


USDCAD is showing signs of bottoming. Price has recapture key Fibonacci level and could move higher over the coming weeks. What are the key levels to watch out for and how much higher can we go?
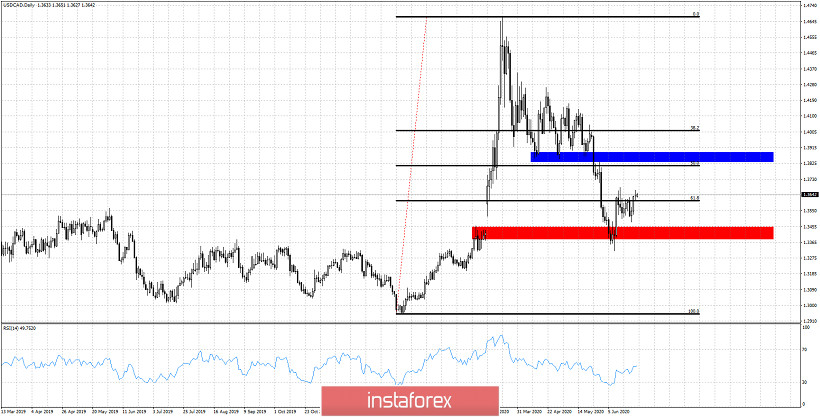
Red rectangle - key support
Blue rectangle - resistance
USDCAD has closed the gap from February and is bouncing back above the 61.8% Key Fibonacci support. Price has resistance at 1.38-1.39 and a short-term move towards that level is not out of the question. A rejection at the blue rectangle and or a break below the red rectangle would be bearish signs. Bulls want to stay above the red rectangle and start making higher highs and higher lows and eventually recapture the blue rectangle area. In the short-term we favor a move towards 1.38-1.39. Breaking above it will increase the chances of a longer-term upward move that could break above March highs.


