


On March 20, the EURUSD pair has expressed remarkable bullish recovery around the newly-established bottom around 1.0650.
Bullish engulfing H4 candlesticks as well as the recently-demonstrated ascending bottoms indicated a high probability bullish pullback at least towards 1.1065 (Fibo Level 50%).
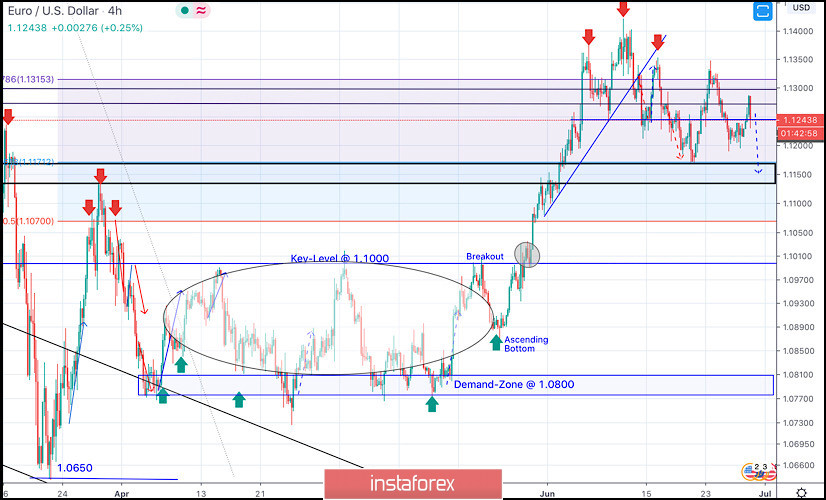
Shortly after, a sideway consolidation range was established in the price range extending between 1.0770 - 1.1000.
On May 14, evident signs of Bullish rejection as well as a recent ascending bottom have been manifested around the price zone of (1.0815 - 1.0775), which enhances the bullish side of the market in the short-term.
Bullish breakout above 1.1000 has enhanced further bullish advancement towards 1.1175 (61.8% Fibonacci Level) then 1.1315 (78.6% Fibonacci Level) where bearish rejection was anticipated.
Although the EUR/USD pair has temporarily expressed a bullish breakout above 1.1315 (78.6% Fibonacci Level), negative divergence as well as bearish rejection were being demonstrated in the period between June 10th- June 12th.
This suggested a probable bearish reversal around the Recent Price Zone of (1.1270-1.1315) to be watched by Intraday traders.
Hence, Bearish persistence below 1.1250-1.1240 (Head & Shoulders Pattern neckline) was needed to confirm the pattern & to enhance further bearish decline towards 1.1150
Trade recommendations :
The recent bullish pullback towards the price zone around 1.1300-1.1350 (recently-established supply zone) was recommended to be watched by Intraday Traders as a valid SELL Signal.T/P levels to be located around 1.1175 then 1.1100 while S/L to be lowered to 1.1350 to offset the associated risk.


