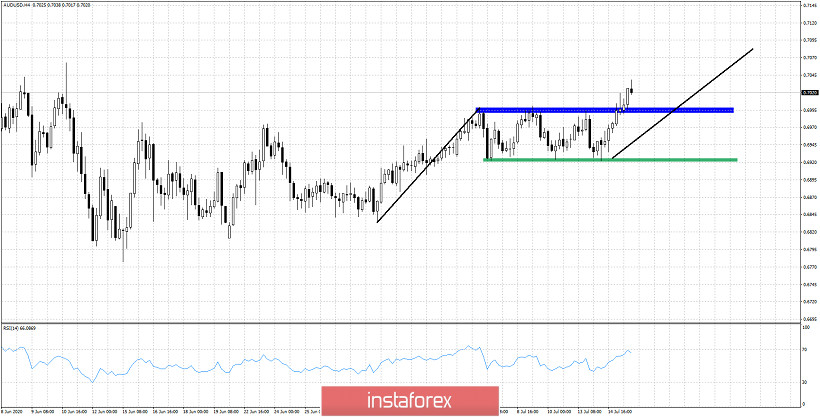
In a previous analysis we noted the the trading range AUDUSD was in. In our last analysis we noted that we preferred to be bullish as the risk reward ratio for favorable towards bulls. The risk was smaller for bulls as the stop loss level was very close by.

Blue rectangle - resistance
Green rectangle -support
In our last analysis price was close to the green rectangle support area and lower trading range boundary. We were bullish then. Price was expected to move at least towards the blue resistance area. Price has broken above the resistance area. This is a bullish sign. Price could continue higher towards our target of 0.70. Support is now found in the blue rectangle. Previous resistance is now support. A back test pull back towards that level is justified but not necessary.


