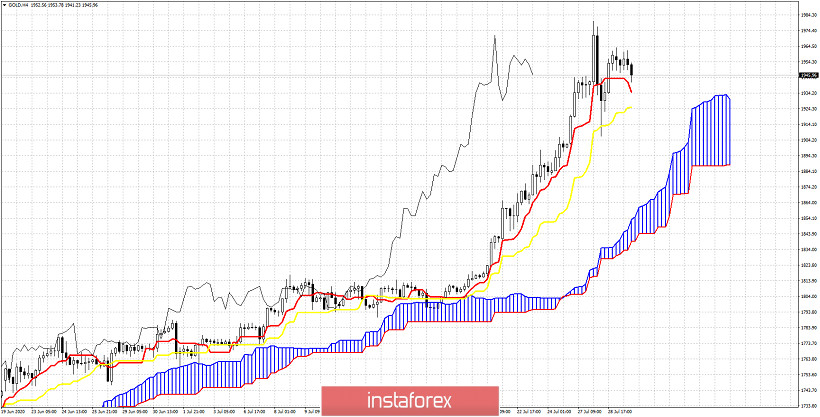
Gold price is in a bullish trend. Price has risen in a parabolic pattern over the last few days making new all time highs above $1,900. Our targets of $1,930 and $1,964 have been met. Our next target is $2,010. However Gold price is showing signs of a possible pull back.

Using the Ichimoku cloud indicator we are going to identify the price levels that if broken will signal that a pull back is coming. As you can see the price remains above the tenkan-sen (red line indicator). Breaking below it ($1,934) will be the first weakness sign. The next support and key level is shown by the kijun-sen (yellow line indicator) at $1,925. A 4 hour close below that level will open the way for a bigger pull back towards the cloud body (Kumo). Depending on time, the pull back should push inside the $1,850-$1,900 range. We will know more when we see the break of support. Until then we remain short-term bullish looking for $2,010.


