Gold price is showing signs of a short-term top. Price has made an impressive upward move of nearly 200$ after the base and break out at $1,800. Trend is bullish still but today we identify some price levels that if broken could signal a deeper pull back.

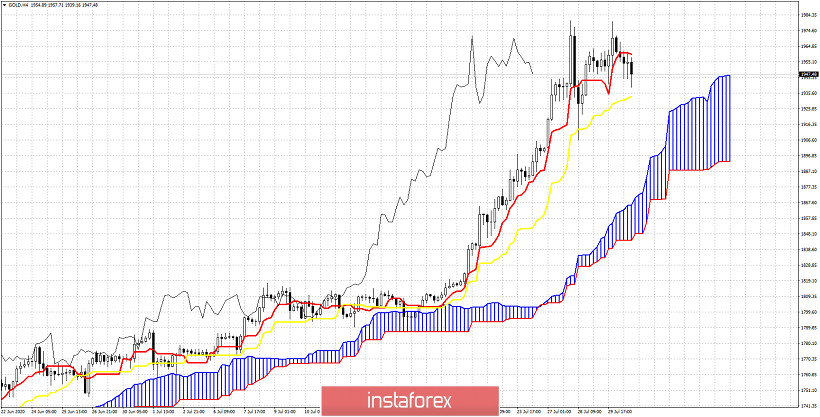
Gold price is trading below the tenkan-sen (red line indicator). This is a first weakness sign. Support is now found at the kijun-sen at $1,933. A break below this support level will open the way for a move towards the Kumo (cloud). The next support is at the Kumo at $1,870-$1,900.

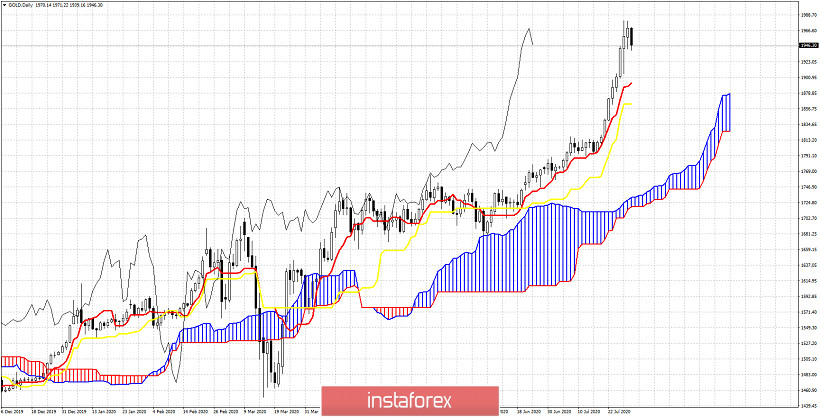
This support area coincides with the tenkan-sen and kijun-sen in the Daily chart. Breaking below $1,870-$1,900 will be another bearish sign that would imply a bigger pull back should be expected maybe towards $1,800. It is still too early however to talk about such a pull back. Trend remains bullish and as expected by our latest analysis, Gold bulls are profit taking as we getting closer to the weekend. The market will give us the signs so we need to be prepared. For now we continue to expect $2,010 to be reached. This scenario will be postponed if price breaks $1,933.


