[#NDX]
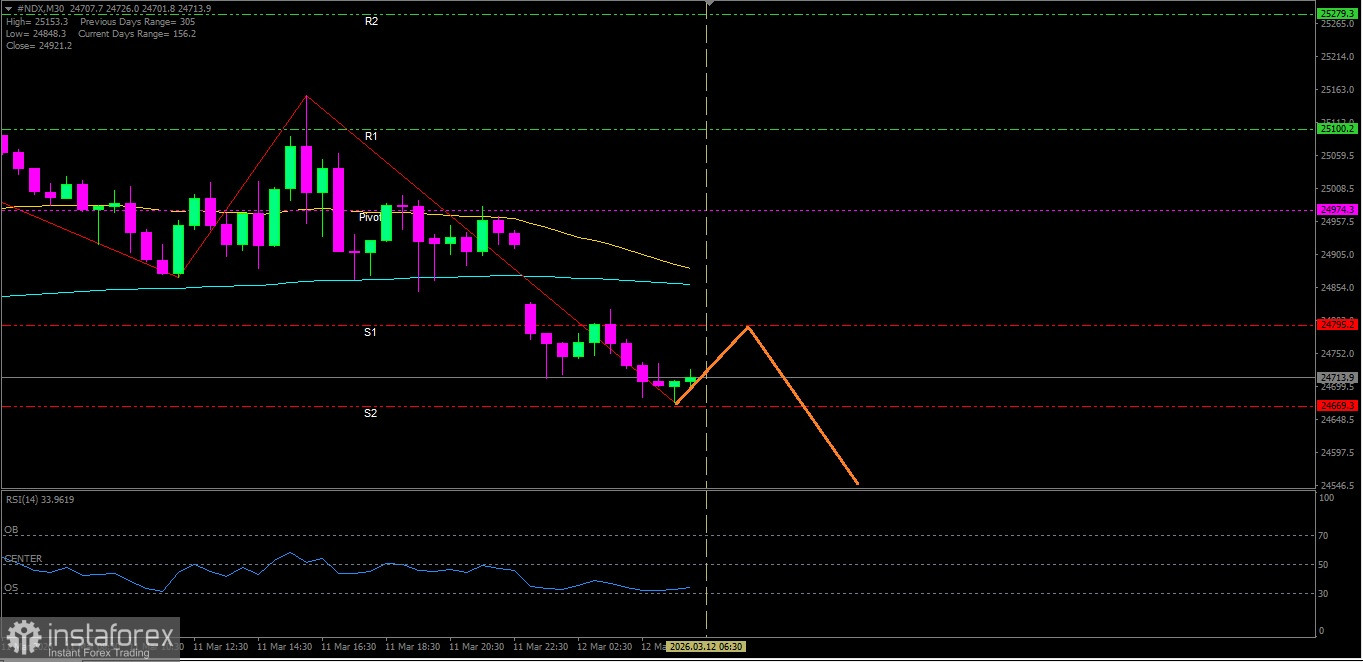
With RSI(14) condition in the Neutral-Bearish level and the price below EMA(50) and EMA(200), it shows that sellers are quite dominant at the moment.
Key Levels
1. Resistance. 2 : 25279.3
2. Resistance. 1 : 25100.2
3. Pivot : 24974.3
4. Support. 1 : 24795.2
5. Support. 2 : 24669.3
Tactical Scenario
Pressure Zone: If #NDX breaks down below 24,795.2, there is potential for continued pressure toward 24,669.3.
Momentum Extension Bias: If 24,669.3 is breached, #NDX could try to test 24,490.2.
Invalidation Level / Bias Revision
The downside bias is restrained if #NDX strengthens and breaks above 25,279.3.
Technical Summary
EMA(50) : 24890.1
EMA(200): 24860.8
RSI(14) : 32.98
Economic News Release Agenda:
From the United States the following economic data will be released:
US - Unemployment Claims - 19:30 WIB
US - Building Permits - 19:30 WIB
US - Housing Starts - 19:30 WIB
US - Trade Balance - 19:30 WIB
US - Natural Gas Storage - 21:30 WIB
US - 30-y Bond Auction - 01:00 WIB