Main Quotes Calendar Forum
flag

FX.co ★ Ichimoku cloud indicator analysis of EURUSD

parent
Forex Analysis:::2020-08-07T20:53:26

Ichimoku cloud indicator analysis of EURUSD

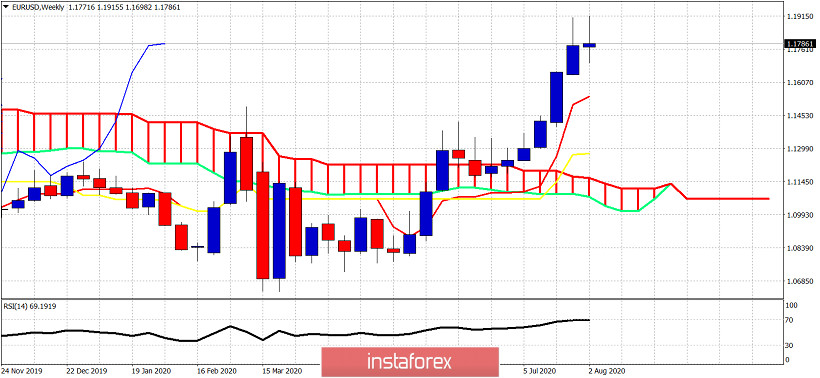
For a consecutive week price managed to move above 1.19 but week closed below 1.18. Trend might still be bullish but the weakness of bulls to recapture 1.19 implies that a deeper pull back might be in store for us for next week.
Ichimoku cloud indicator analysis of EURUSD

As can be seen in the weekly chart above this weekly candle has same long upper tail as last week's candlestick. This candlestick formation confirms the importance of resistance at 1.19-1.18 area.
Ichimoku cloud indicator analysis of EURUSD

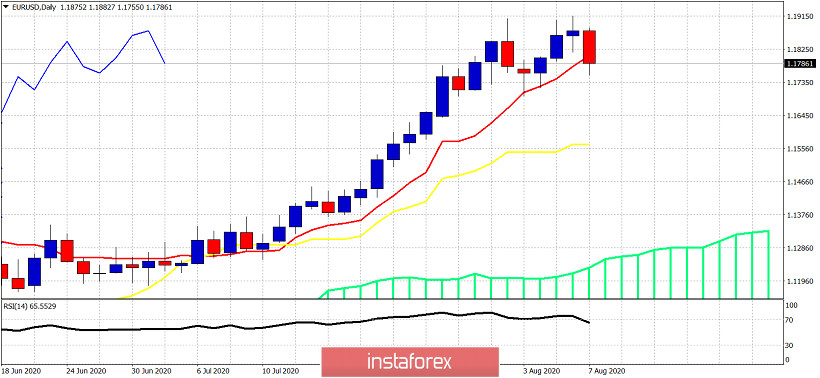
On a daily basis, Friday's candlestick has closed below the tenkan-sen (red line indicator). This is a weak sell signal or better a warning signal of more downside to come. Technically support is now found at 1.17. Staying below the tenkan-sen will push price towards the kijun-sen at 1.1565. So this is our next downside target if price breaks below 1.17.
Analyst InstaForex
Share this article:
parent
loader...
all-was_read__icon
You have watched all the best publications
presently.
We are already looking for something interesting for you...
all-was_read__star
Recently published:
loader...
More recent publications...