


- Capacity Utilization improved more than expected in the same period.
Industrial Production in the United States expanded by 3% on a monthly basis in July, the Federal Reserve reported on Friday. This reading followed June's increase of 5.7% (revised from 5.4%) and came in line with the market expectation.

As I discussed in the previous review, the Gold is in the sideways mode and I still wait for the directional breakout.
Further Development
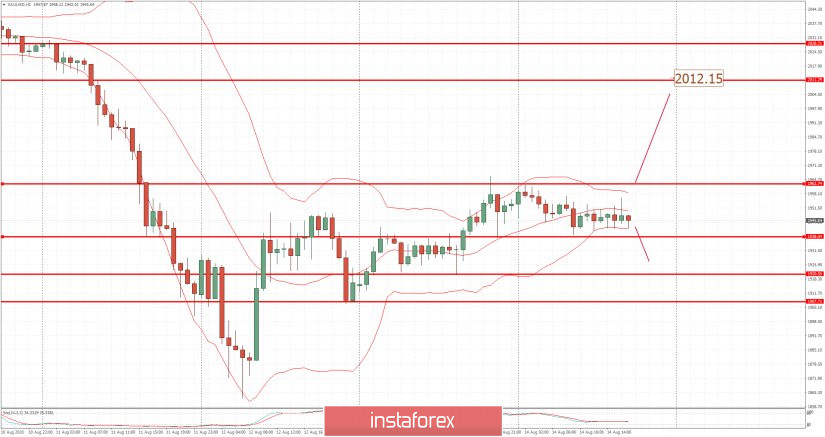
Analyzing the current trading chart, I found that the best option is to wait fo the breakout of either support or resistance.
The breakout of the resistance at $1,962 might confirm further test of $2,012
The breakdown of support at $1,938 might confirm further downside movement towards $1,920 and $1,907.
Watch for the buying opportunities on the dips.
1-Day relative strength performance Finviz
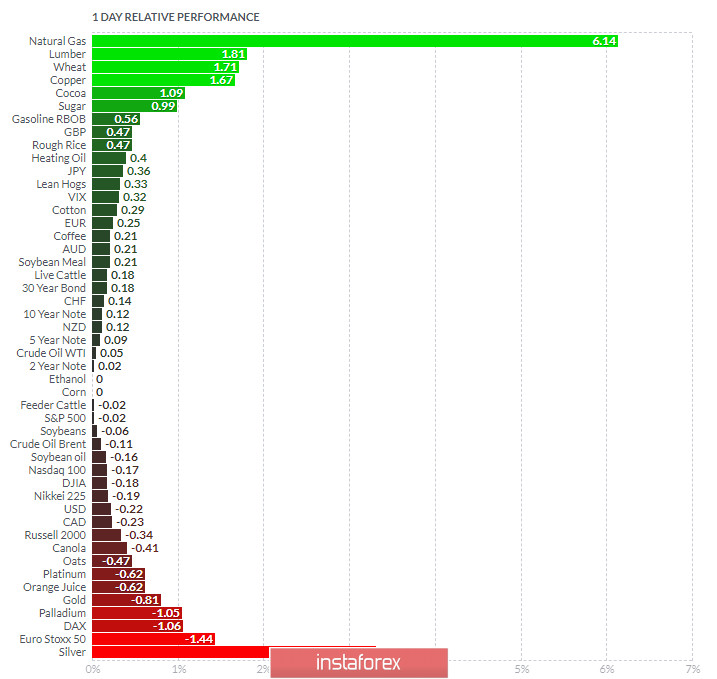
Based on the graph above I found that on the top of the list we got Natural gas and Lumber, on the bottom Silver and Euro Stoxx 50
Gold is still in negative territory.
Key Levels:
Support: $1,938


