Technical Market Outlook:
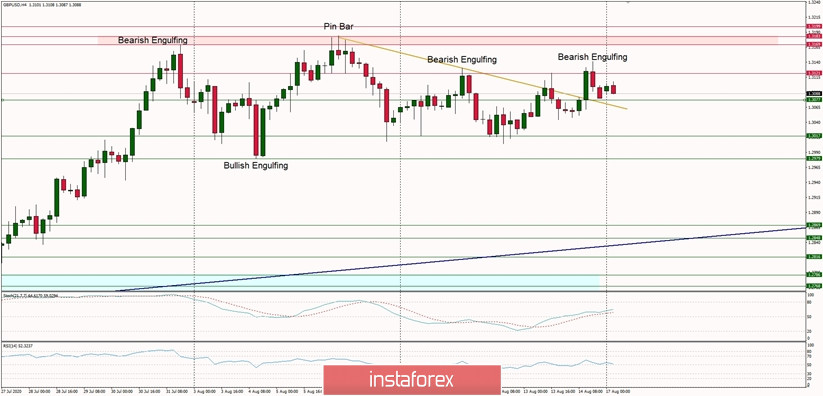
The GBP/USD pair has been trading inside of the narrow range seen between the levels of 1.3181 - 1.2979 for more than two weeks and all attempts to rally has failed for now. The recent short-term trend line breakout has ended up at the level of 1.3121, which is the local technical resistance in the middle of the small trading range. The Bearish Engulfing candlestick pattern at the top of this move indicates a false break and a possible pull-back towards the level of 1.3077 first and then towards the level of 1.3017. However, as long as the level of 1.2979 is not clearly violated, all the down waves will be treated just as a pull-backs, not a corrections. The momentum remains around the fifty level as well, so the volatility is now decreasing.
Weekly Pivot Points:
WR3 - 1.3292
WR2 - 1.3216
WR1 - 1.3155
Weekly Pivot - 1.3068
WS1 - 1.3000
WS2 - 1.2930
WS3 - 1.2880
Trading Recommendations:
On the GBP/USD pair the main, multi-year trend is down, which can be confirmed by the down candles on the monthly time frame chart. Nevertheless, the recent rally form the multi-year lows seen at the level of 1.1404 has been successful and the trend might be reversing. The key long-term technical resistance is seen at the level of 1.3518. Only if one of these levels is clearly violated, the main trend might reverse (1.3518) or accelerate towards the key long-term technical support is seen at the level of 1.1404.