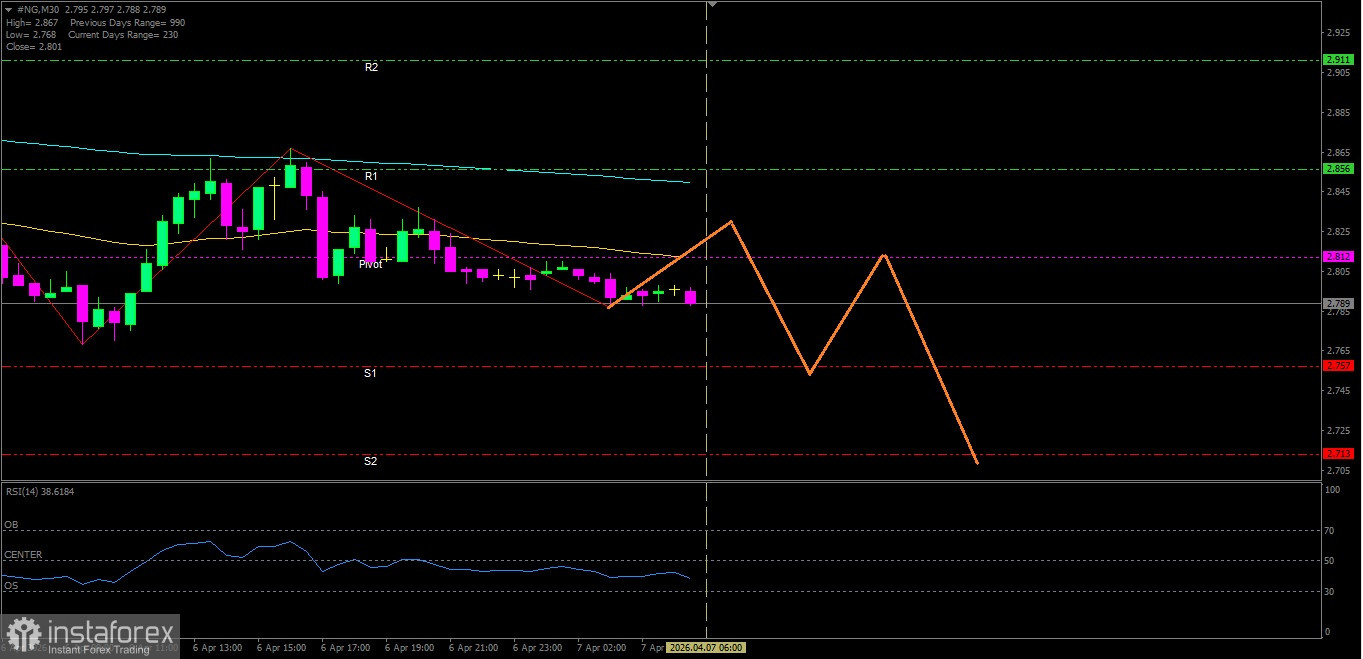
[Natural Gas]
With a Death Cross condition between EMA(50) with EMA(200), supported by RSI(14) indicator in the Neutral-Bearish level, then there is a potential for continuing weakness in Natural Gas toward its nearest support level.
Key Levels
1. Resistance. 2 : 2.911
2. Resistance. 1 : 2.856
3. Pivot : 2.812
4. Support. 1 : 2.757
5. Support. 2 : 2.713
Tactical Scenario
Pressure Zone: If the price breaks down below 2.757, there is potential to test 2.713.
Momentum Extension Bias: If 2.713 is also broken, the probability of further weakness to 2.658 is quite high.
Invalidation Level / Bias Revision
The downside bias is restrained if Natural Gas strengthens and breaks above 2.911.
Technical Summary
EMA(50) : 2.812
EMA(200): 2.850
RSI(14) : 38.61
Economic News Release Agenda:
Today the United States will release the following economic data:
US - ADP Weekly Employment Change - 19:15 WIB
US - Core Durable Goods Orders m/m - 19:30 WIB
US - Durable Goods Orders m/m - 19:30 WIB
US - RCM/TIPP Economic Optimism - tentative
US - Consumer Credit m/m - 02:00 WIB
US - API Weekly Statistical Bulletin - 03:30 WIB