


Daily timeframe
The general picture:
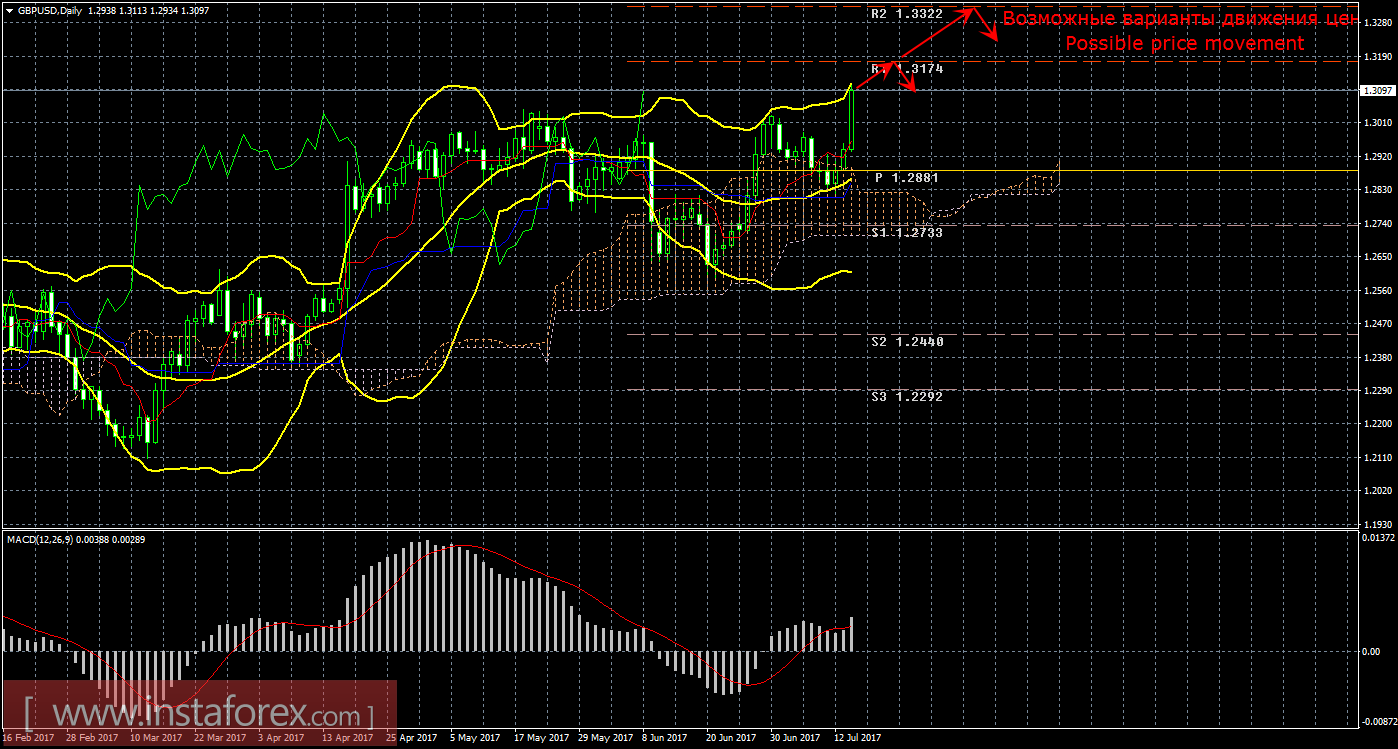
The pound sterling in the last three days of last week showed a solid growth of 250 points due to Janet Yellen's weak performance in Congress, because of a decrease in inflation in the United States and a high probability of an increase in the Bank of England's key rate. The current "golden cross" remains confirmed and strong, and the targets for the upward movement are the resistance levels of 1.3174 and 1.3322. The upward movement will remain relevant if the price remains above the Kijun-sen line (1.2850). Fixing the price below this line will weaken the "golden cross", further upward movement will be called into question, the downward movement can continue with the aim of the lower boundary of the Ichimoku cloud. The MACD indicator signals a resume in moving up, its downward turn may indicate a new round of corrective movement. Bollinger Bands indicates continuation of the upward movement, the bands expand and point upwards. The most interesting news for the GBP / USD pair in the coming week will be the consumer price index on Tuesday, the inflation report on Wednesday and retail sales on Thursday. But from America, no important economic news is expected.
Trading recommendations:
A correction for the GBP / USD currency pair was completed. It is now recommended to consider long positions with target levels of 1.3174 and 1.3322. Stop-loss orders when trading is recommended to have an increase below 1.2850. You can manually reduce orders to buy by rebounding the price from the first target or in case the MACD indicator turns down. When the profit level is reached for a long transaction of 100-200 points, it is recommended to transfer the order to breakeven. The Take-Profit orders can be placed slightly below the target. Short positions at the moment are not relevant.
Explanations to the illustration:
Ichimoku Indicator:
Tenkan-sen is the red line.
Kijun-sen is the blue line.
Senkou Span A is the light brown dotted line.
Senkou Span B is the light purple dotted line.
Chinkou Span is the green line.
Bollinger Bands Indicator:
3 yellow lines.
MACD indicator:
Red line and histogram with white bars in the indicator window.


