


Review of the currency pair AUD / USD with the current day forecast
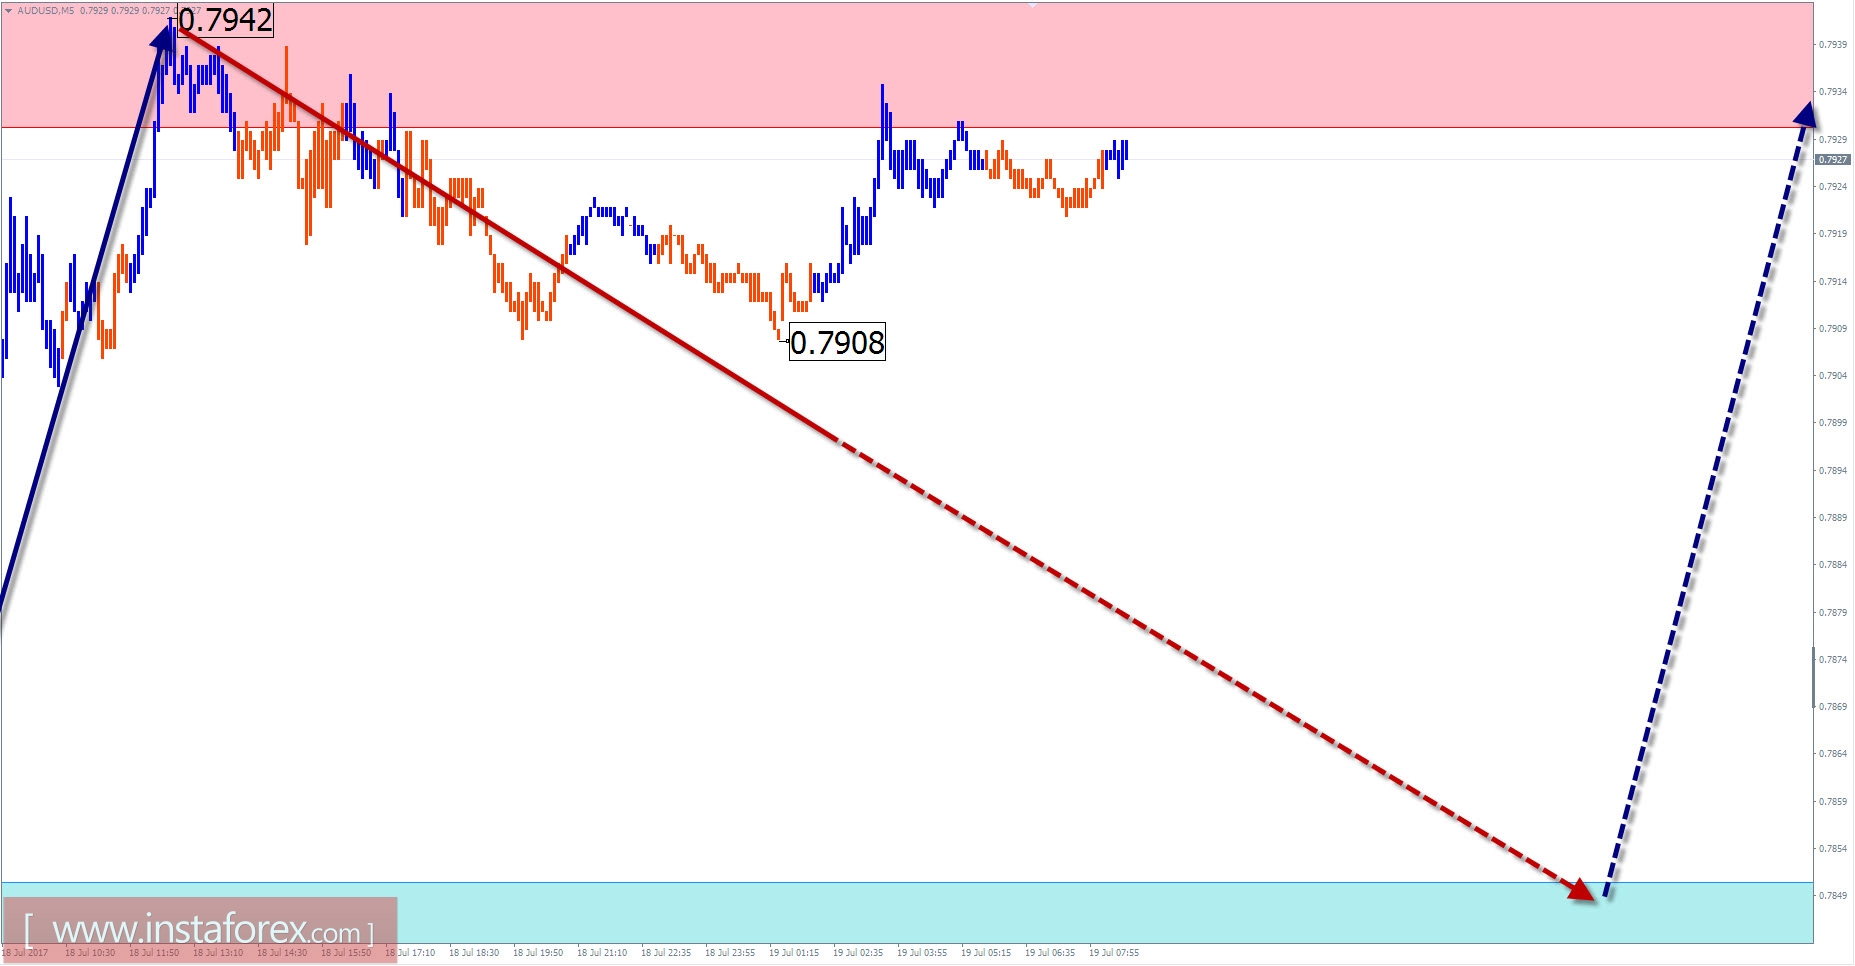
From the beginning of last year, a large scale of the price chart of the Australian dollar demonstrates the formation of the corrective geometric figure "ascending triangle". Wave analysis indicates the completeness of the model structure. The final part of the wave this year formed a distinct zigzag. The last segment of May 9 has a pronounced impulse appearance. The price has come very close to the lower boundary of the preliminary settlement zone, where the probability of completion of the entire correction is strongest.
Today, the most realistic scenario will be the correction of yesterday's recovery. The resistance zone is expected to turn and lower the price, down to the support zone. The nature of the oscillations is likely to be flat.
Boundaries of resistance zone:
- 0.7930 / 60
Boundaries of support zone:
- 0.7850 / 20
Review of the currency pair GBP / JPY with the current day forecast
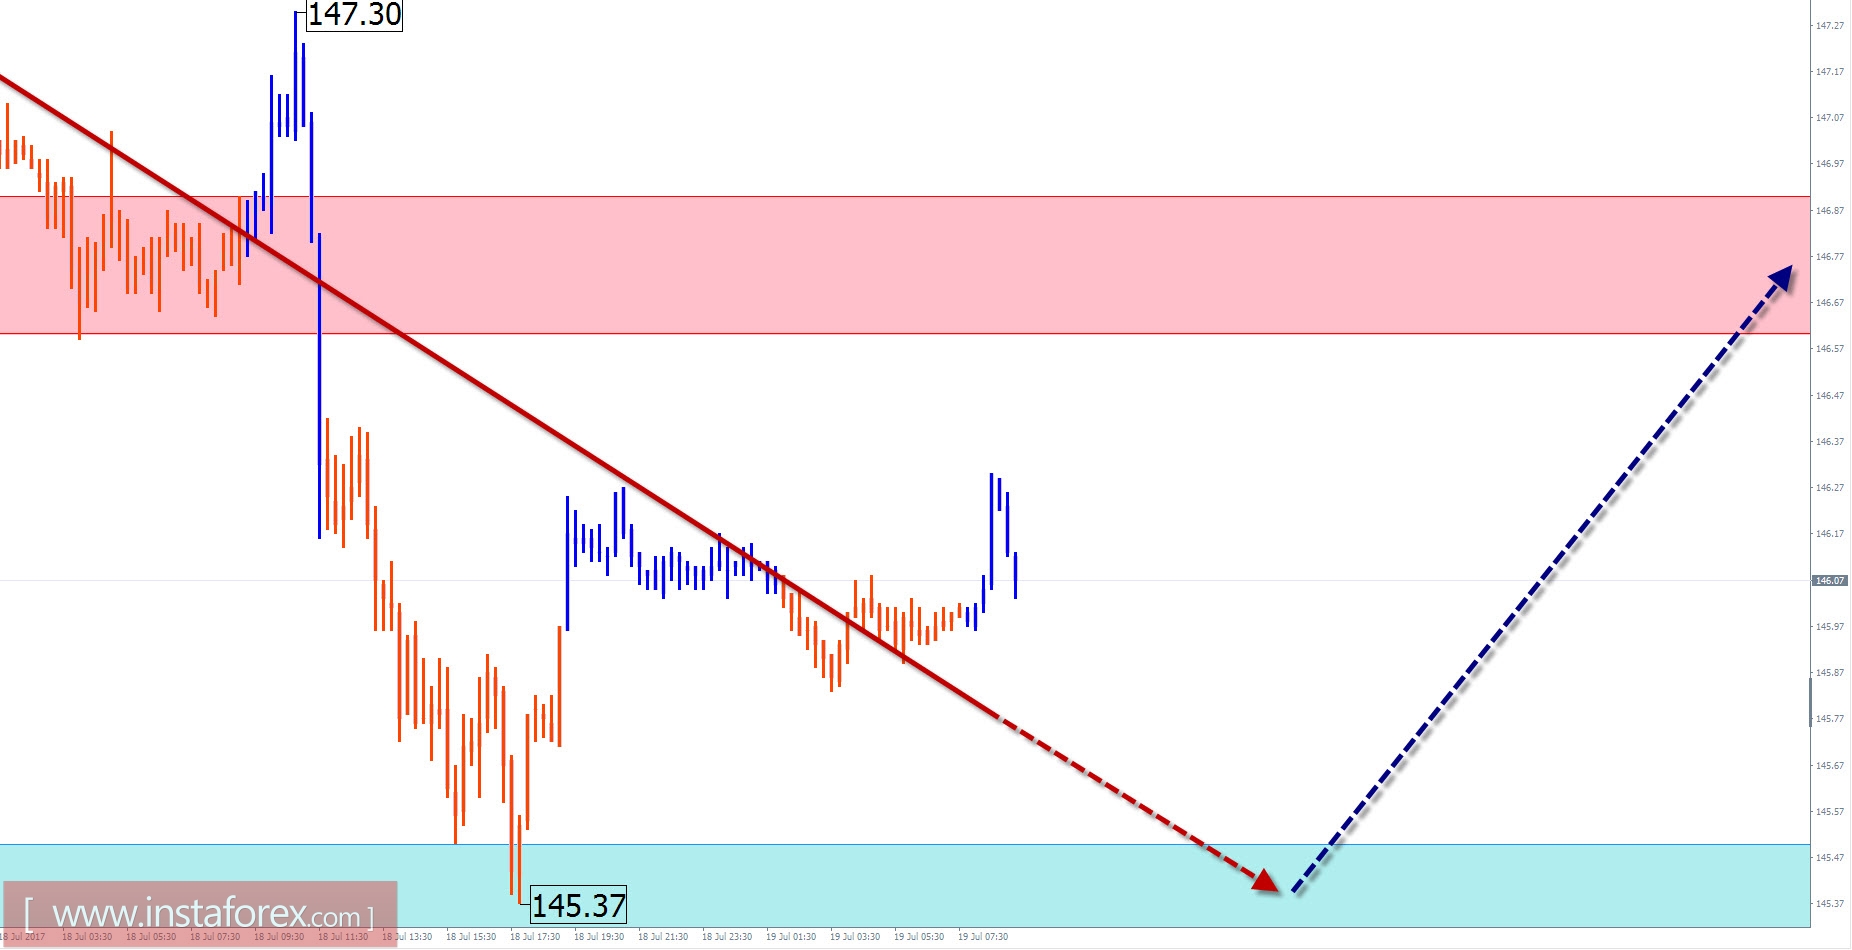
Looking at the weekly chart scale of the pound / yen, the corrective essence of the upward wave that began in June last year is visible. Extreme prices form a clear ascending "pennant". Current quotations of the pair prop up its upper limit. The probability of breaking through the resistance zone is estimated rather high, as indicated by the incompleteness of the structure of the current wave model. The preliminary calculation of the target traffic segment shows the lower limit of the potential end zone in the area of the 152nd price figure.
After the hidden correction was completed a week ago, the price fluctuations of the pair form a reversal zigzag.
Over the course of the next trading sessions, the following are expected: the completion of a decline, the formation of a reversal and the beginning of the growth of quotations. Raising the price above the boundaries of the resistance zone within the day is unlikely.
Boundaries of the resistance zone:
- 146.60 / 90
Boundaries of the support zone:
- 145.50 / 20
Explanations to the figures: For simplified wave analysis, a simple waveform is used that combines 3 parts (A; B; C). Of such waves, all kinds of correction are composed and most of the impulses. On each considered time-frame the last, incomplete wave is analyzed.
The zones marked on the graphs are indicated by the calculation areas in which the probability of a change in the direction of motion is significantly increased. Arrows indicate the wave counting according to the technique used by the author. The solid background of the arrows indicates the structure formed, the dotted line indicates the expected wave motion.
Note: The wave algorithm does not take into account the duration of the tool movements in time. The forecast is not a trading signal! To conduct a transaction, you need to confirm the signals used by your trading systems.


