


Review of the currency pair NZD / USD with the current day forecast
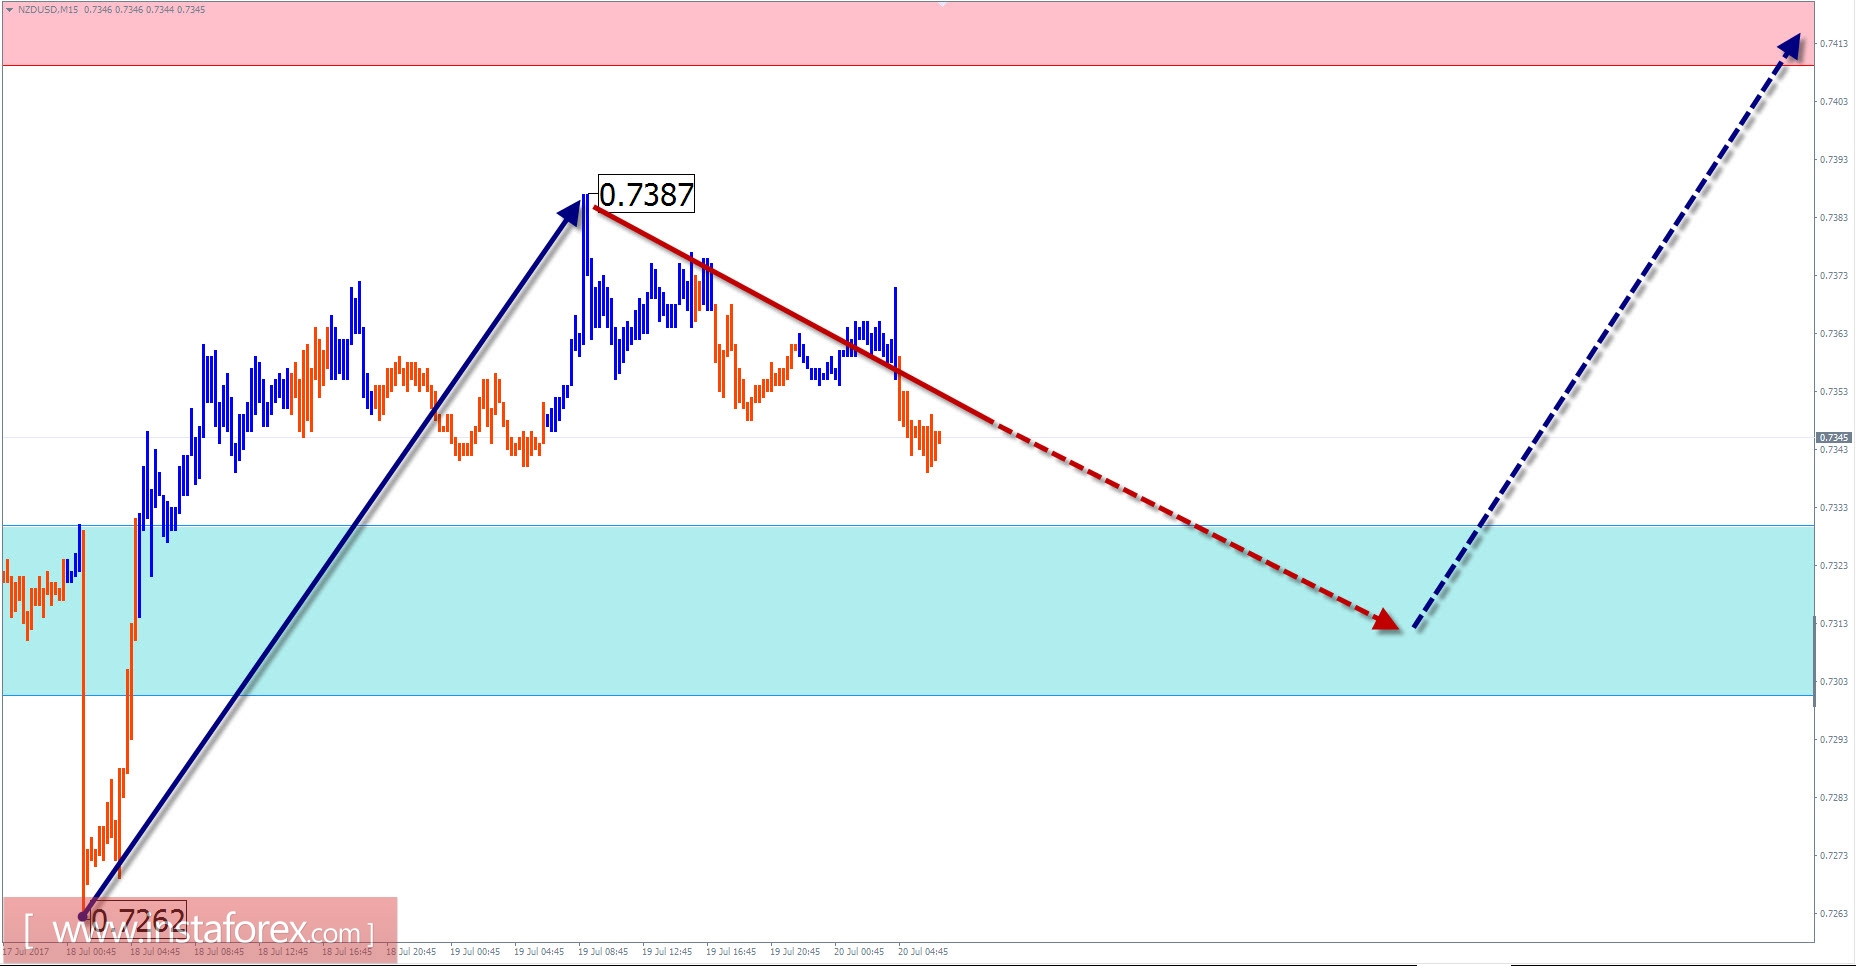
A correction is formed on the weekly scale of the New Zealand dollar chart. Directing an upward wave from a two-year short-term trend is in the final phase. Quotations of the pair reached the lower boundary of the reversal section of the chart, where the chance of completing the entire wave is strong.
On July 18, at the very end of the wave, a new zigzag wave started in the main direction. By the current day, the middle part (B) is getting closer to its completion. The beginning of an intensive increase in prices for the final part (C) can be expected today.
At the upcoming session, the reduction is expected to end. The formation of a turn is most likely within the framework of settlement support.
Boundaries of the resistance zone:
- 0.7410 / 40
Boundaries of the support zone:
- 0.7330 / 0.7300
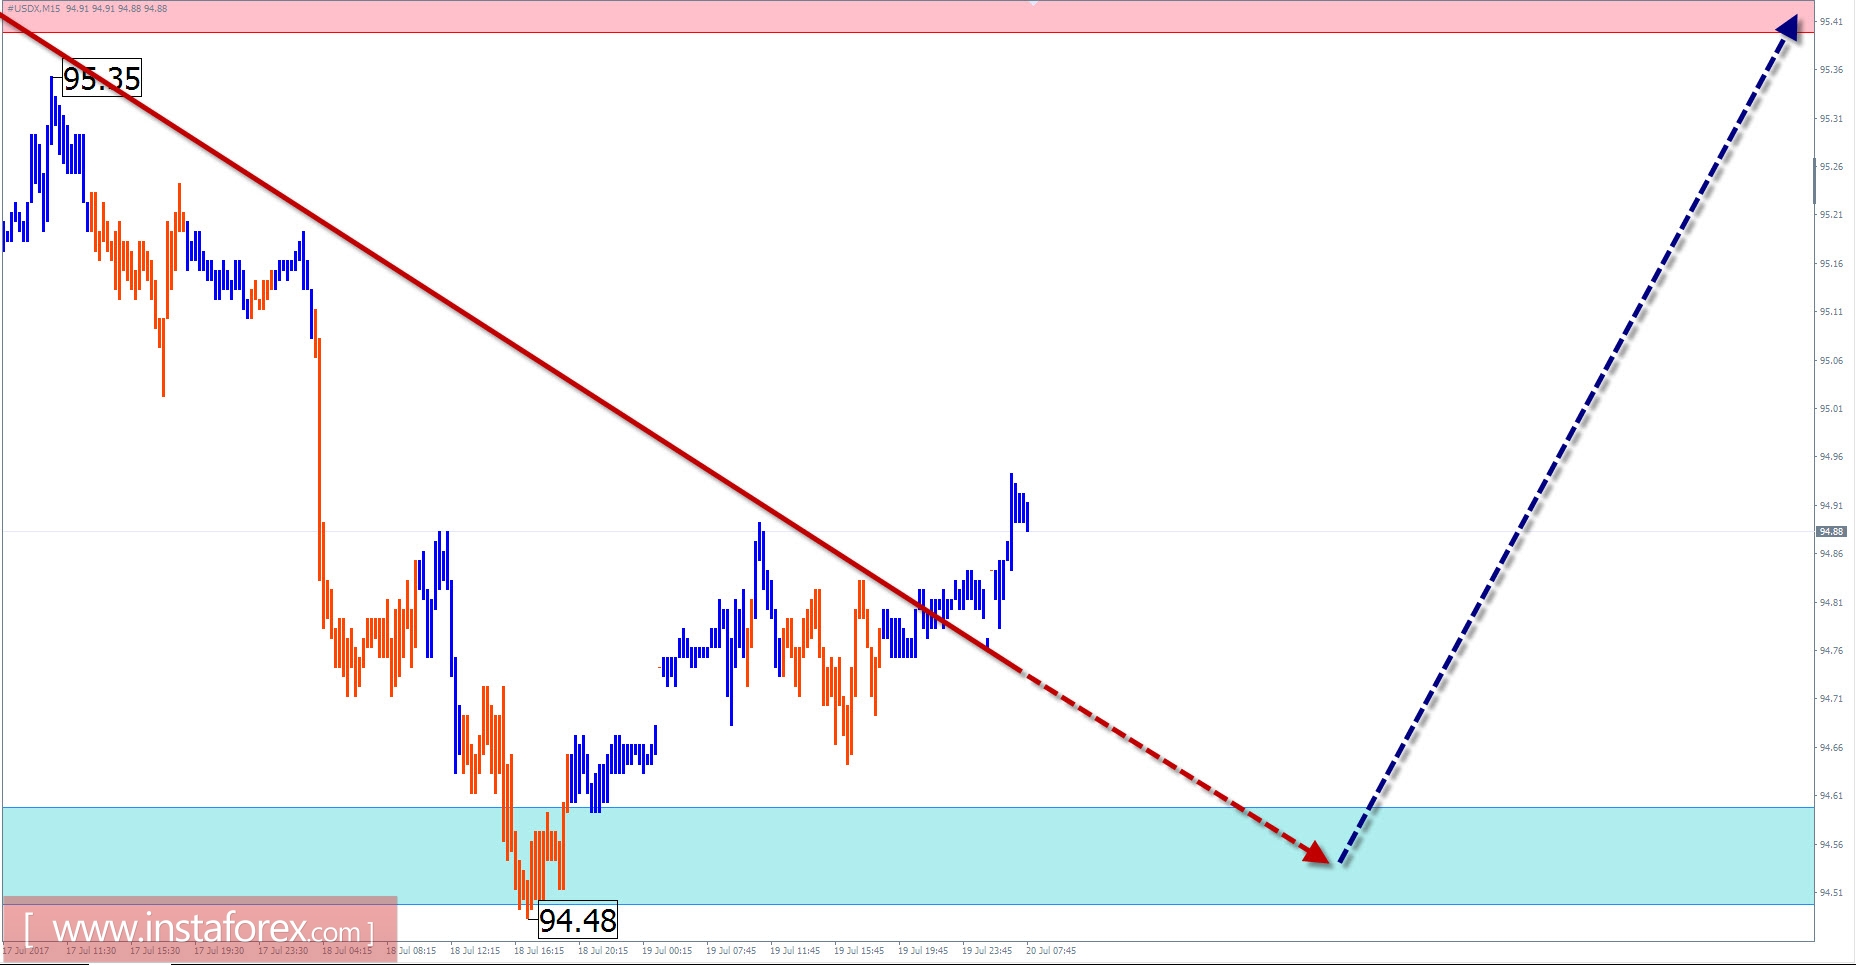
Review of #USDX (US dollar index) with the current day forecast
Since the beginning of this year, the chart of the American currency index continues the depreciation. This trend was not a surprise. Its prerequisites arose in the middle of last year, when in the major correctional model, the middle part of the movement entered the final phase. The calculation of the preliminary goal indicates the proximity of the upper boundary of the probable completion zone. From the current values, it separates no more than 4 daily average moves of the instrument.
Within the current wave in the last 2 weeks, a hidden correctional structure has formed, in which the final spurt is lacking. The upward swing limits the resistance zone. Today, preparation for a change of direction is expected. In the morning, an attempt is made to pressure the support zone. The active growth phase at the moment may shift tomorrow.
Boundaries of the resistance zone:
- 95.40 / 50
Boundaries of the support zone:
- 94.60 / 50
Explanation of the figures: For simplified wave analysis, a simple type of wave is used that combines 3 parts (A; B; C). Of such waves, all kinds of correction are composed and most of the impulses. On each considered time-frame the last, incomplete wave is analyzed.
The zones marked on the graphs are indicated by the calculation areas in which the probability of a change in the direction of motion is significantly increased. Arrows indicate the wave counting according to the technique used by the author. The solid background of the arrows indicates the structure formed and the dotted line indicates the expected wave motion.
Note: The wave algorithm does not take into account the duration of the tool movements in time. The forecast is not a trading signal! To conduct a transaction, you need to confirm the signals used by your trading systems.


