Technical Market Outlook:
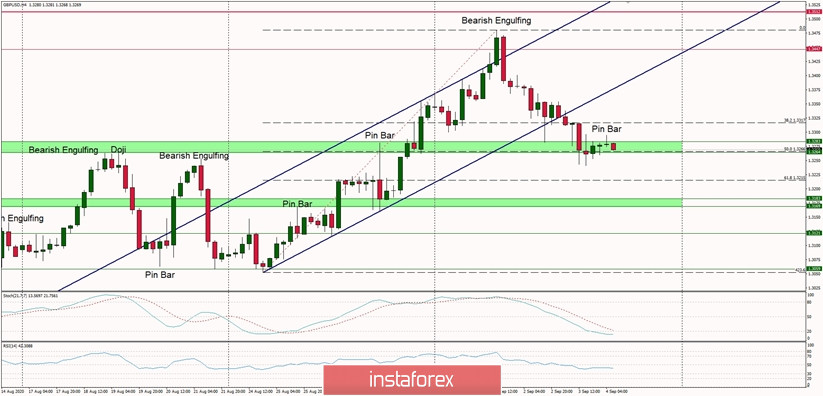
The GBP/USD pair has felt out of the parallel channel and made a new local low at the level of 1.3241, slightly below the 50% Fibonacci retracement seen at the level of 1.3266. The next technical support is seen at the level of 1.3215 and 1.3183. This is the immediate support for bulls and a clear violation of this level will be an intraday bearish signal. Weekly and monthly time frame trend remains up, so if the bullish pressure sustain, then the next target for bulls is seen at the level of 1.3447. Please notice, the market conditions are now oversold on the H4 time frame chart, so after a spike down a relief rally might occur.
Weekly Pivot Points:
WR3 - 1.3797
WR2 - 1.3564
WR1 - 1.3482
Weekly Pivot - 1.3256
WS1 - 1.3192
WS2 - 1.2962
WS3 - 1.2882
Trading Recommendations:
On the GBP/USD pair the main, multi-year trend is down, which can be confirmed by the down candles on the monthly time frame chart. Nevertheless, the recent rally form the multi-year lows seen at the level of 1.1404 has been successful and the trend might be reversing. The key long-term technical resistance is seen at the level of 1.3518. Only if one of these levels is clearly violated, the main trend might reverse (1.3518) or accelerate towards the key long-term technical support is seen at the level of 1.1404.


