


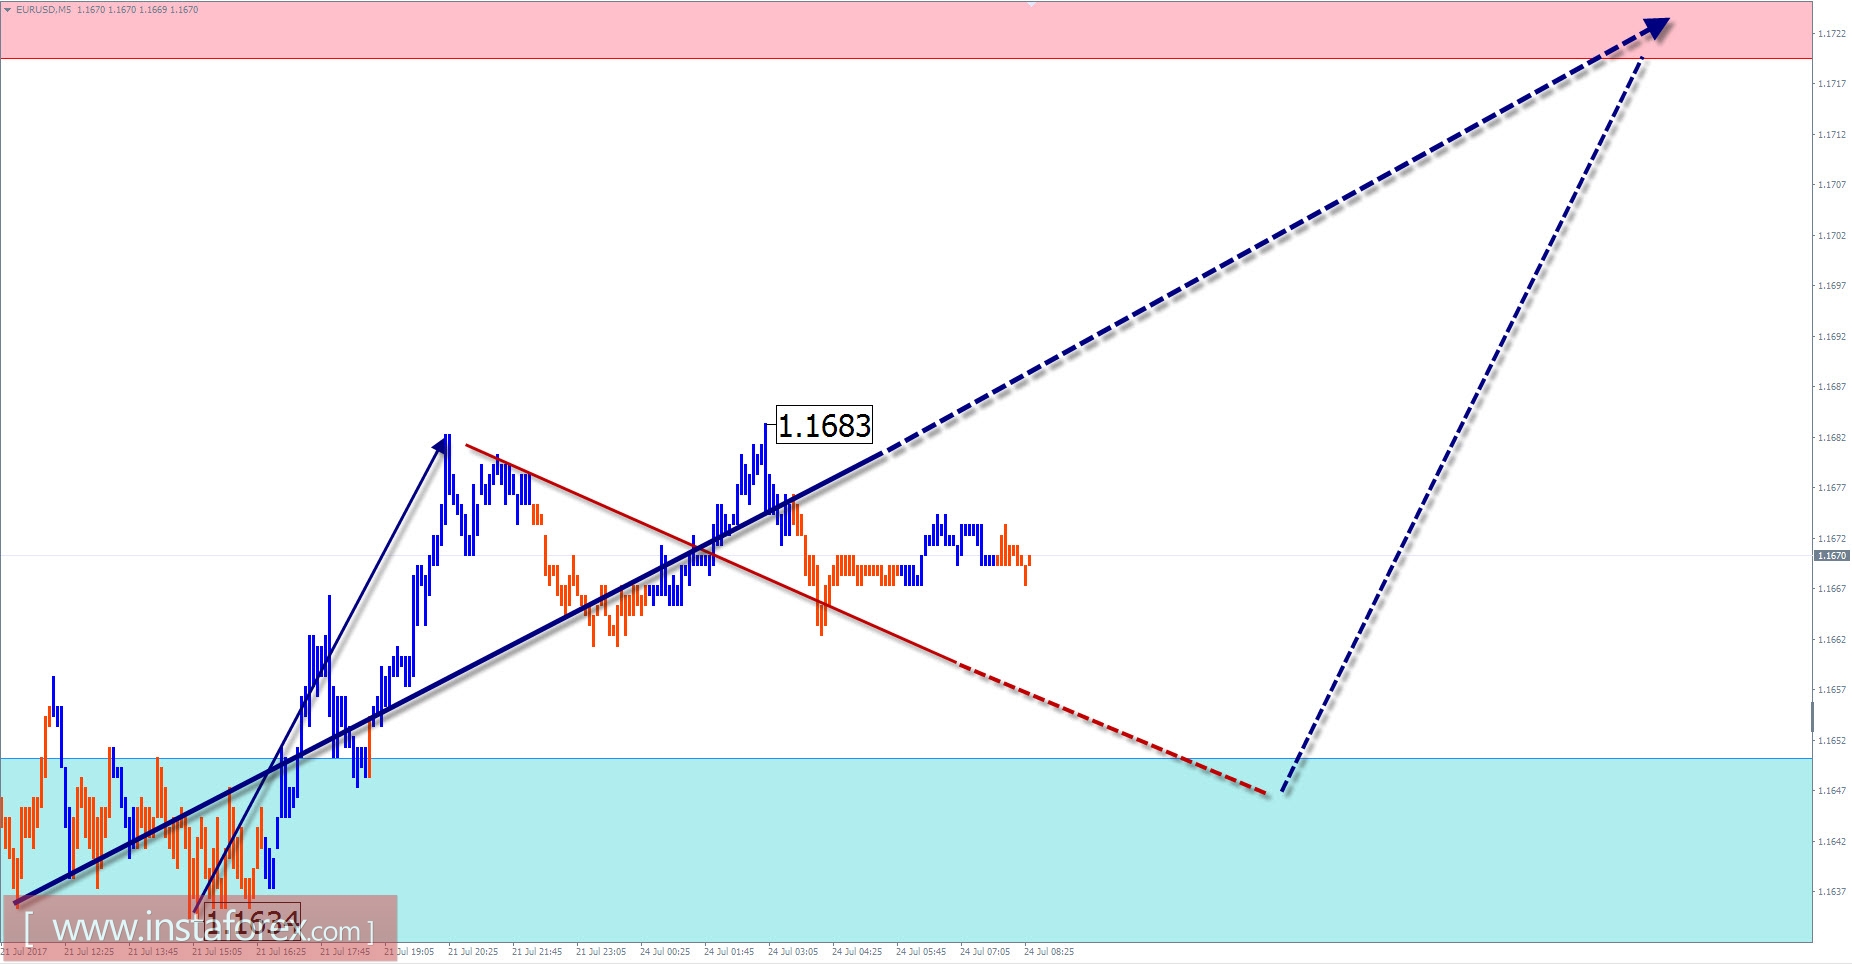
Overview of the currency pair EUR / USD with the current day forecast
The correction formed the figure "stretched plane" on the chart of the main pair of euros. The structure of the wave looks complete. The preliminary calculation of the target zone allows to assume a price increase within five price figures from the current level. The lower boundary of the potential reversal section coincides with the calculated zone of resistance. After the contact with the price in the next few days, you can wait for the formation of oncoming traffic of the pair.
Today, a general upward trend is expected. In the morning, a short-term flat can be excluded, with a possible lowering of the rate to the support zone. The active phase of movement is more expected at the end of the day.
Boundaries of the resistance zone:
-1.1720 / 50
Boundaries of the support zone:
-1.1650 / 20
Overview of the currency pair USD / JPY with the current day forecast
A bearish trend is observed on the chart of the Japanese yen this month. In the wave structure, this site takes the place of correction of the first section of the bull wave, which started in early June. Given the flat appearance of the structure, the potential for reducing the current correction extends to the level of the local minimum of the middle of last month.
After the previously formed hidden correction, the decline that began last Thursday gave an additional impetus to the current wave. Today, the formation of a counter-rollback is most likely. The size of the expected rise is limited by the zone of resistance. Return to the main direction of traffic can be expected at the end of the day or the next day.
Boundaries of the resistance zone:
- 111.50 / 80
Boundaries of the support zone:
- 110.70 / 40
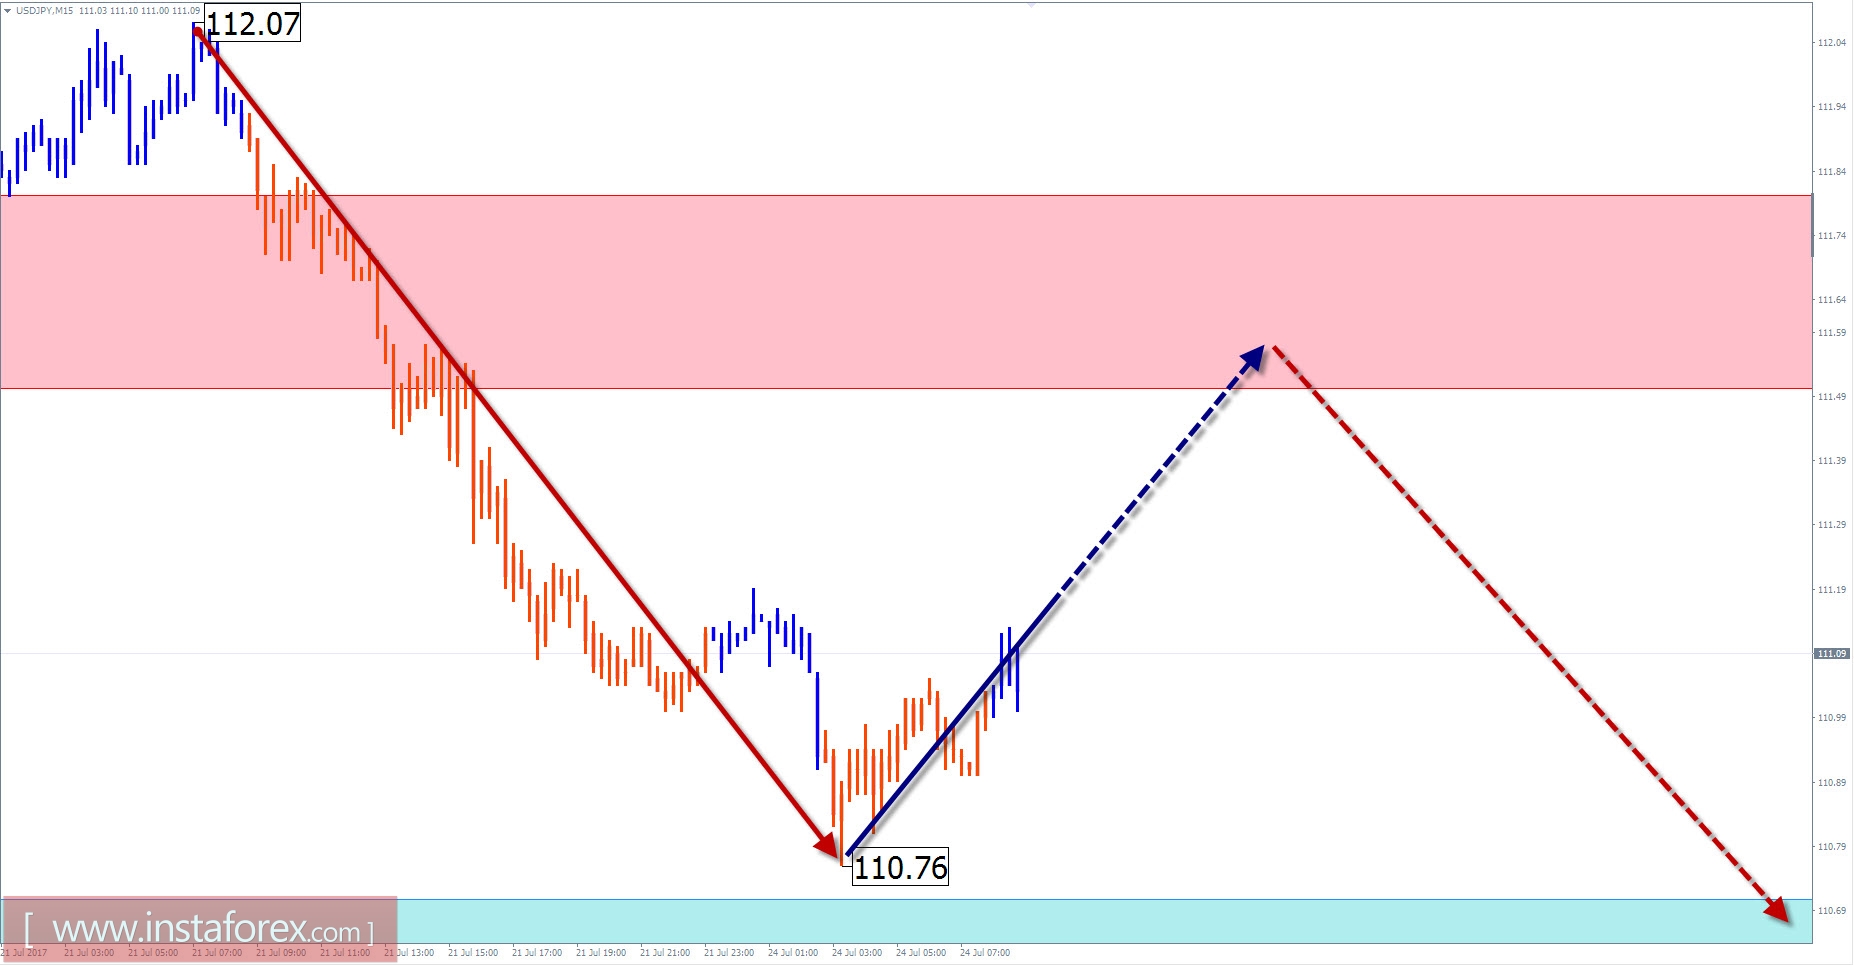
Explanations to the figures: For simplified wave analysis, a simple type of wave is used that combines 3 parts (A; B; C). Of such waves, all kinds of correction are composed and most of the impulses. On each considered time-frame the last, incomplete wave is analyzed.
The zones marked on the graphs are indicated by the calculation areas in which the probability of a change in the direction of motion is significantly increased. Arrows indicate the wave counting according to the technique used by the author. The solid background of the arrows indicates the structure formed, the dotted line indicates the expected wave motion.
Note: The wave algorithm does not take into account the duration of the tool movements in time. The forecast is not a trading signal! To conduct a transaction, you need to confirm the signals used by your trading systems.


