


Gold price made a higher weekly high than last week, but price got under pressure and closed in negative territory. Price continues to hold inside the long-term bullish channel and above the key short-term support of $1,900-$1,920.
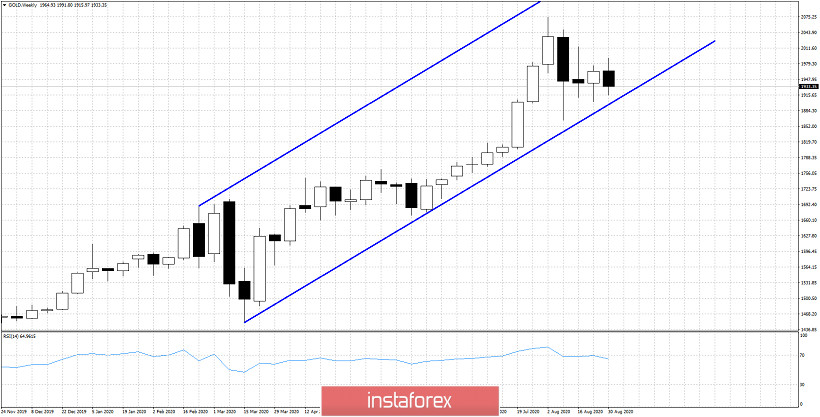
Gold price the last three weeks is mostly moving sideways after making a high at $2,074. As long as price holds above recent week's lows, we should expect another run higher towards $2,100 and higher. First important obstacle for bulls is the $1,992 high of this past week. A weekly close above it will increase the chances of seeing $2,100 and higher. Breaking below $1,900 will open the way for a pull back towards $1,850-$1,800.


