XPD/USD
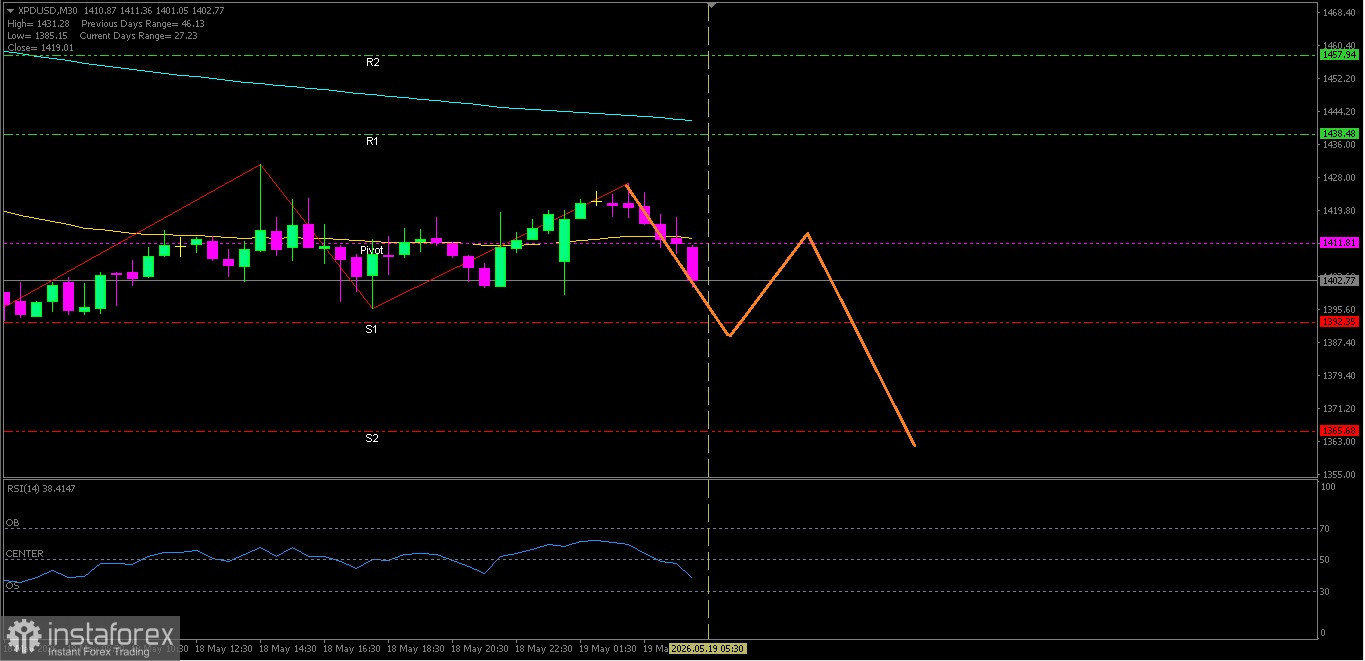
With both EMAs forming a Death Cross intersection and RSI(14) indicator in the Neutral-Bearish level, then in the near term XPD/USD has the potential to test its nearest support level.
Key Levels
1. Resistance. 2 : 1457.94
2. Resistance. 1 : 1438.48
3. Pivot : 1411.81
4. Support. 1 : 1392.35
5. Support. 2 : 1365.68
Tactical Scenario
Pressure Zone: If 1411.81 is broken down, there is potential for further weakness toward 1392.35.
Momentum Extension Bias: If 1392.35 is also broken to the downside, #XPD/USD could move toward 1365.68.
Invalidation Level / Bias Revision
The downside bias is restrained if the price breaks above 1457.94.
Technical Summary
EMA(50) : 1413.52
EMA(200): 1442.34
RSI(14) : 47.89
Economic News Release Agenda:
The United States will release the following economic data:
US - ADP Weekly Employment Change 19:15 WIB
US - Pending Home Sales m/m - 21:00 WIB
US - API Weekly Statistical Bulletin - 03:30 WIB