


The bearish wave of the US dollar index, which started at the beginning of the year, reached a wide critical area of the schedule, from which it is worth waiting for oncoming traffic. The analysis of the structure of the long-term downward wave shows the incompleteness of the model, therefore it is impossible to talk about changing the trend. The tool is waiting for corrective lifting. The preliminary calculation shows a high probability of a course increase up to the 96th figure.
We zoom in on the search for the last unfinished design. On the hourly chart, there is a bearish wave, which began to form after the culminated correction was completed. To complete the formation of the structure, it is required to complete the corrective ascent. After that, you should wait for a second decline, which should update the local low on August 2.
In the coming sessions, the index expects the completion of the corrective recovery. The resistance zone shows the most likely upper bound of daily volatility.
Boundaries of the resistance zone:
- 93.50 / 60
Boundaries of the support zone:
- 92.70 / 60
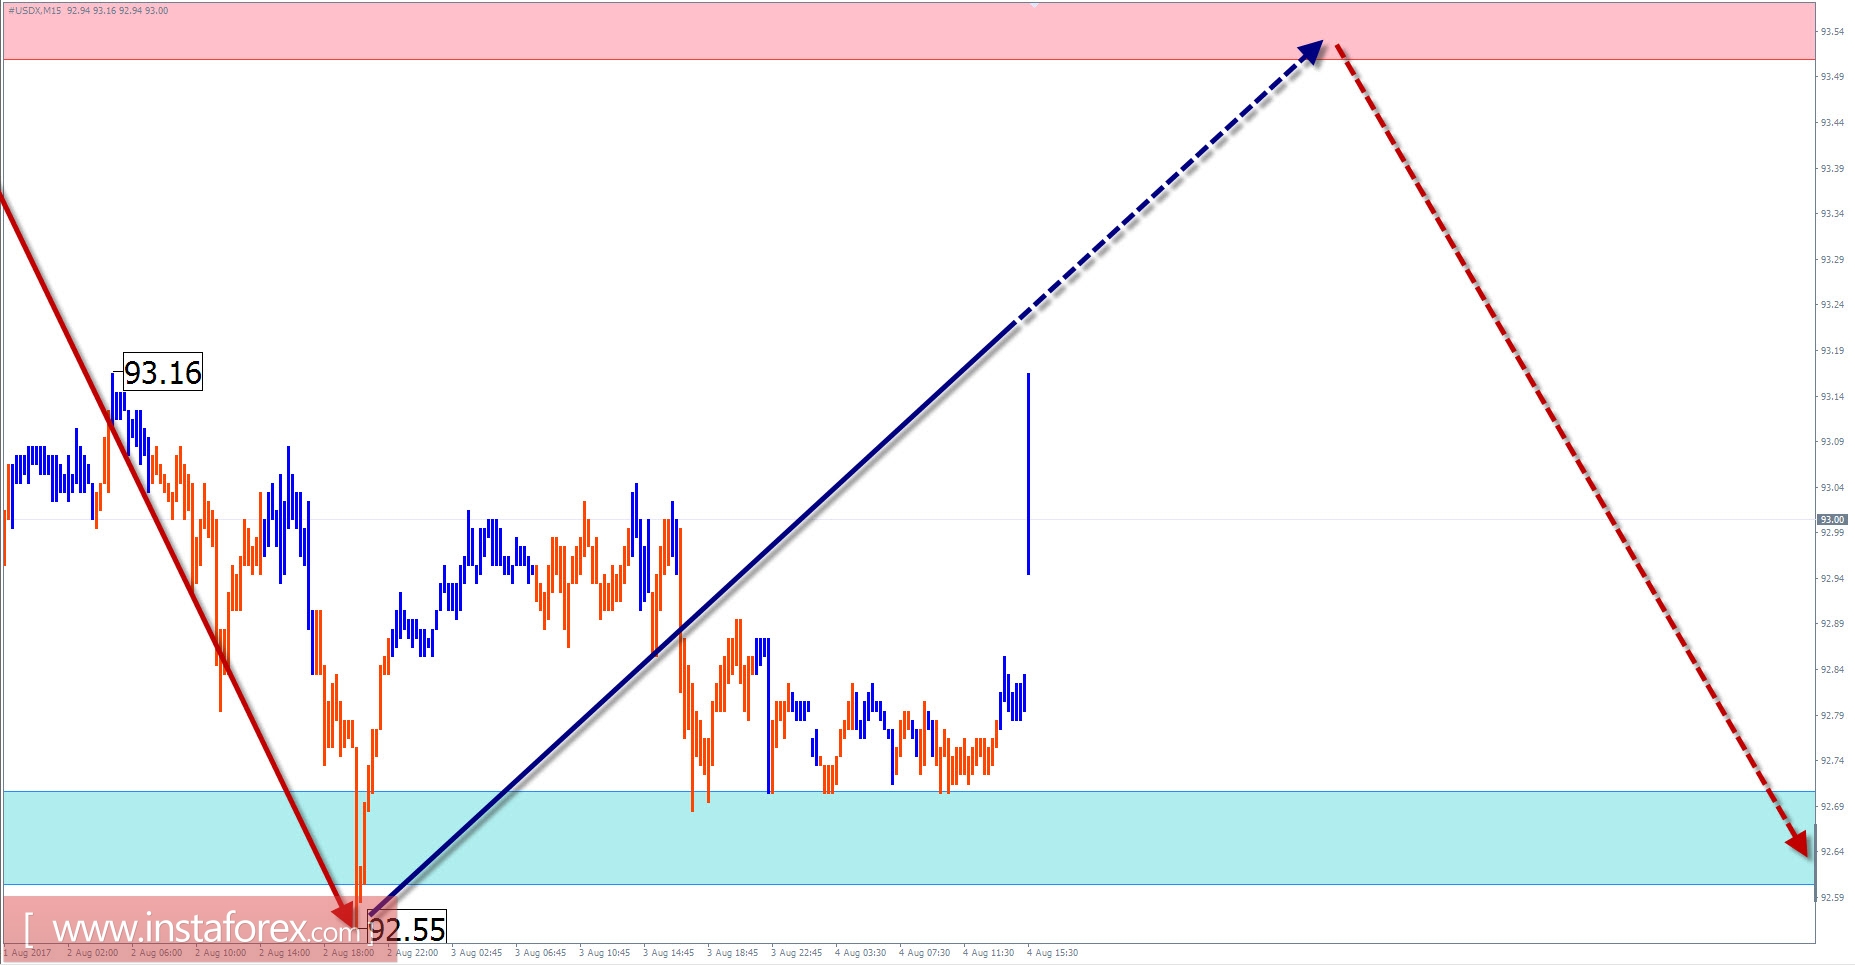
Explanations to the figures: For simplified wave analysis, a simple type of wave is used that combines 3 parts (A; B; C). Of such waves, all kinds of correction are composed and most of the impulses. On each considered time-frame the last, incomplete wave is analyzed.
The zones marked on the graphs are indicated by the calculation areas in which the probability of a change in the direction of motion is significantly increased. Arrows indicate the wave counting according to the technique used by the author. The solid background of the arrows indicates the structure formed, the dotted one indicates the expected wave motion.
Note: The wave algorithm does not take into account the duration of the tool movements in time. The forecast is not a trading signal! To conduct a transaction, you need to confirm the signals used by your trading systems.


