


GBP/JPY
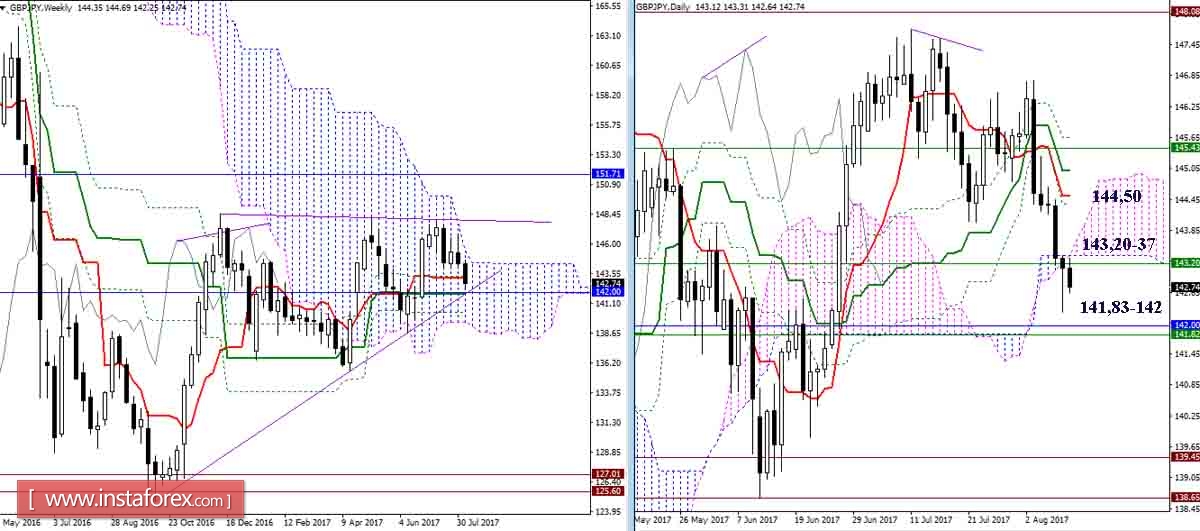
Despite the long lower shadow of the previous day, the pair still retains the location under the daylight cloud (Senkou Span B 143.37) and the week-long Tengkan (143.20). On the younger time frame, these levels serve as the role of resistance. The immediate support and guidance for continuing the decline remain in the area of 141.83 - 142.00 (weekly Kijun + month Tenkan).

The pair is in the correction zone. The accumulation levels of different times form a rather wide resistance zone of 143,20-37-57-77 (Fibo Kijun N4 + cloud N1 + Kijun N4 + levels of the senior half-times). The location below preserves the advantages for the players in a downgrade, but a secure anchorage above the zone will change the balance of the forces of the lower time intervals and will most likely allow the corrective ascent to the cloud of H4 intensified by the day cross levels (Tenkan 144,50 + Kijun 145).
EUR / JPY
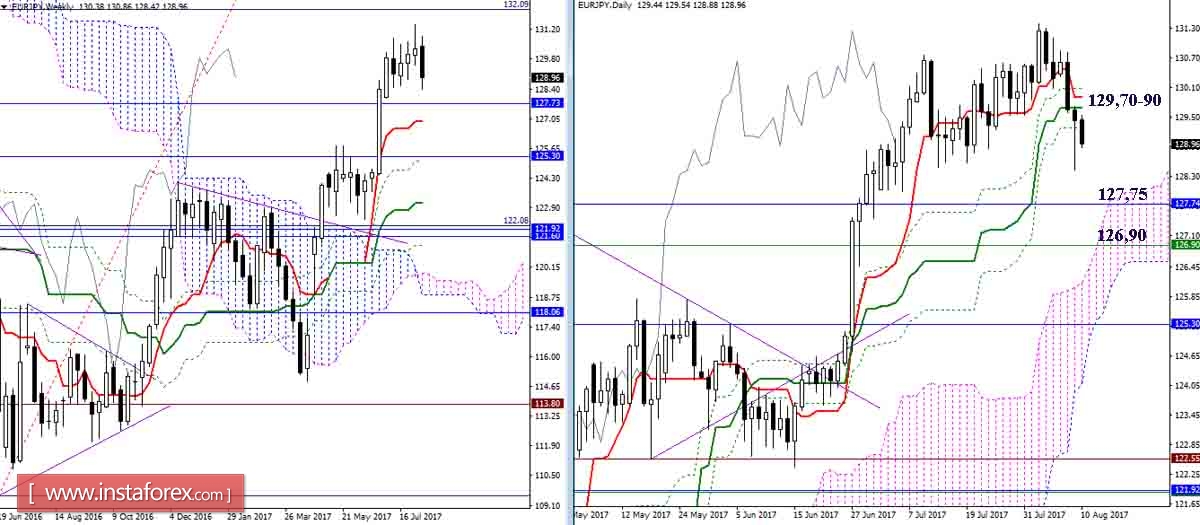
Because of the long interaction with Tenkan and the active work of Kijun on the cross change, the day cross ceased to serve as support. As a result, the pair descended lower, turning the levels of the cross into resistance (129.70-90). The guide for continuing the decline is now a day cloud, reinforced by the levels of the more senior times (the monthly Fibo Kijun 127.75 and the weekday Tenkan 126.90).
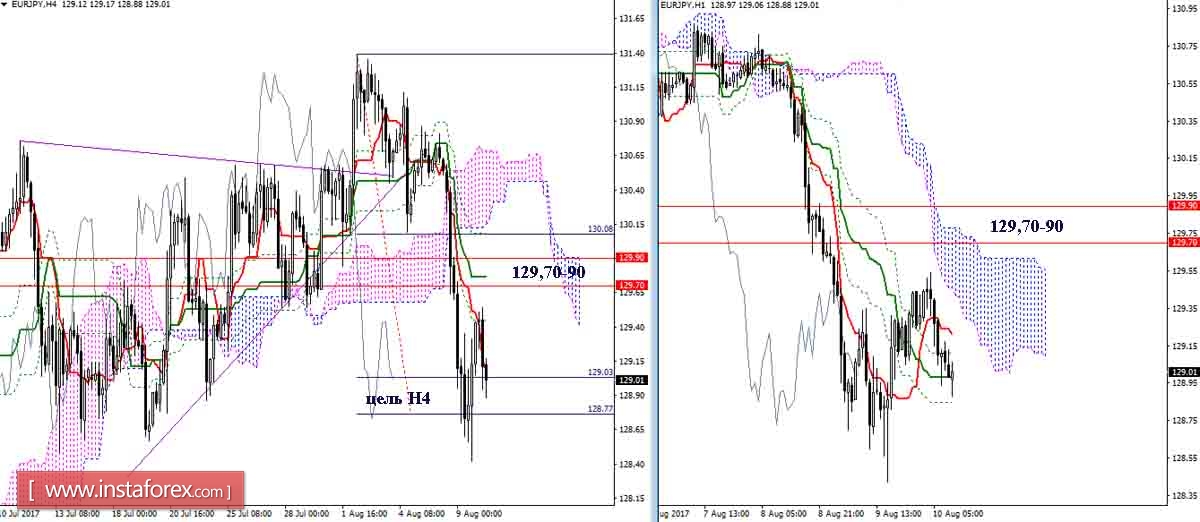
With the fall, the pair fulfilled the goal at the breakdown of the H4 cloud. The goal so far continues to provide support, provoking the development of correction and restraining the offensive of players to a decline. The most significant area of resistance is concentrated today in the region of 129.70-90 (cloud H1 + Kijun H4 + day cross). The breakdown of the zone can affect the implementation of the bearish plans.
Indicator parameters:
All time intervals 9 - 26 - 52
The color of the indicator lines:
Tenkan (short-term trend) - red,
Kijun (medium-term trend) - green,
Fibo Kijun - green dotted line,
Chinkou - gray,
Clouds: Senkou Span B (SSB, long-term Trend) - blue,
Senkou Span A (SSA) - pink.
The color of the additional lines:
Support and resistance MN - blue, W1 - green, D1 - red, H4 - pink, H1 - gray,
Horizontal levels (not Ichimoku) - brown,
Trend lines - purple.


