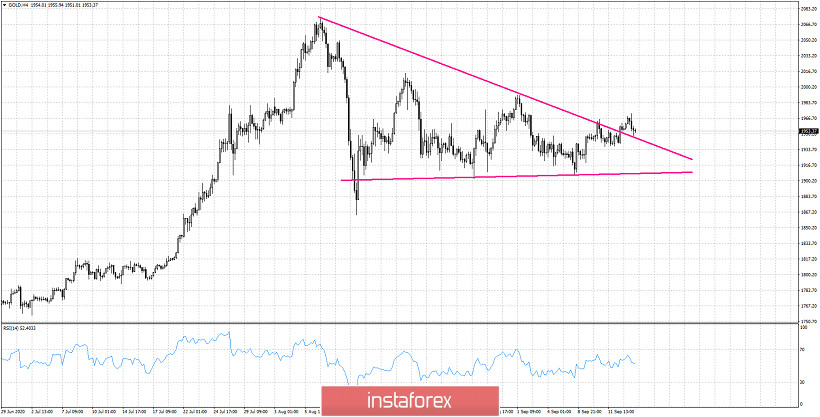
Gold price has broken out of the triangle pattern. This is a bullish sign. Price has now pulled back for a back test. Price should now bounce higher and break above recent highs at $1,972. The horizontal resistance at $1,990 remains intact.

Gold price is out of the triangle pattern. Price is on top of the upper triangle boundary as a back test. For price to continue higher we need to see immediate bounce off the triangle boundary and a break of the horizontal resistance at $1,972 and next at $1,990. Unless price breaks these two levels, we cannot expect a move above $2,000 towards $2,100. Support is found at $1,940 and next at $1,910. Breaking below $1,940 will put $1,910 in danger. Breaking below $1,910-$1,900 will open the way for $1,800-50.


