Main Quotes Calendar Forum
flag

FX.co ★ USD/MXN Price Movement On Sept 16, 2020.

parent
Forex Analysis:::2020-09-16T04:46:41

USD/MXN Price Movement On Sept 16, 2020.

USD/MXN Price Movement On Sept 16, 2020.

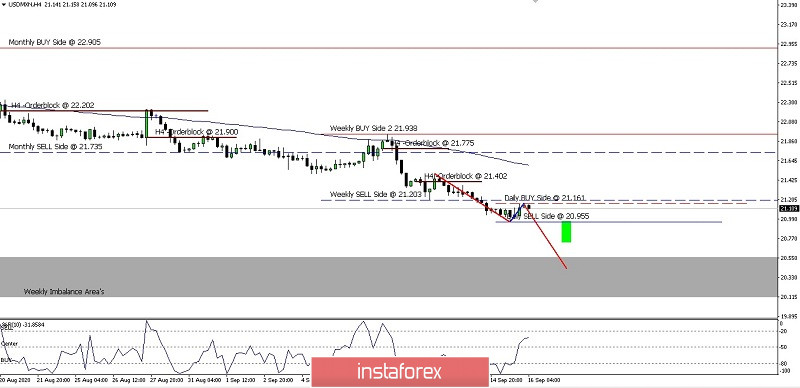
On the 4 hour chart, we can see that the USD/MXN is trading wit the bearish bias. It may decline to the first target at the 20.955 level and the Imbalance Area's (grey area) 20.559 - 20.105 levels as its second target. It is moving below the Moving Average. This scenario will come true if the pair does not rise and fix above the 20.161 level.

(Disclaimer)

Analyst InstaForex
Share this article:
parent
loader...
all-was_read__icon
You have watched all the best publications
presently.
We are already looking for something interesting for you...
all-was_read__star
Recently published:
loader...
More recent publications...