Technical Market Outlook:
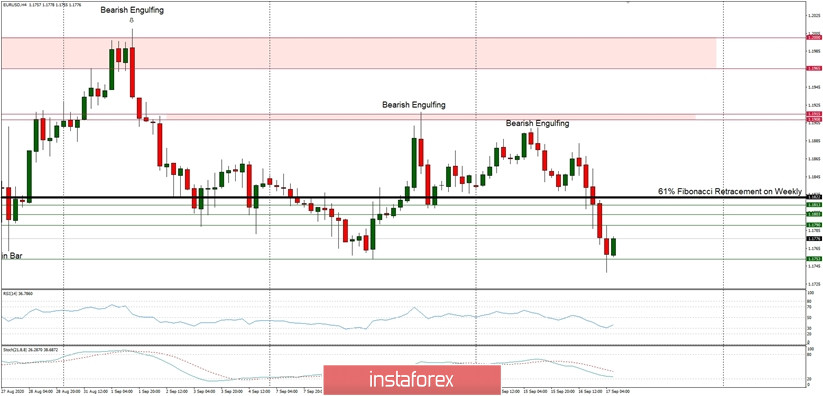
The EUR/USD pair has broken below the 61% Fibonacci retracement level on the weekly time frame chart and made a new local low at the level of 1.1738. The levels of 1.1790, 1.1803 and 1.1813 will now act as an intraday technical resistance for the price, together with the level of 1.1822. Despite the oversold market conditions, the momentum remains weak and negative, so another wave down towards the next target seen at the level of 1.1710 is anticipated. The weekly time frame trend remains up.
Weekly Pivot Points:
WR3 - 1.2085
WR2 - 1.1993
WR1 - 1.1923
Weekly Pivot - 1.1829
WS1 - 1.1753
WS2 - 1.1670
WS3 - 1.1589
Trading Recommendations:
On the EUR/USD pair the main trend is up, which can be confirmed by almost 10 weekly up candles on the weekly time frame chart and 4 monthly up candles on the monthly time frame chart. Nevertheless, weekly chart is recently showing some weakness in form of a several Pin Bar candlestick patterns at the recent top. This means any corrections should be used to buy the dips until the key technical support is broken. The key long-term technical support is seen at the level of 1.1445. The key long-term technical resistance is seen at the level of 1.2555.