Main Quotes Calendar Forum
flag

FX.co ★ Analysis of Gold for September 18,.2020 - Breakout of the rising wedge pattern in the background and potential for the downside movement

parent
Forex Analysis:::2020-09-18T11:11:00

Analysis of Gold for September 18,.2020 - Breakout of the rising wedge pattern in the background and potential for the downside movement

ECB - 16 September 2020 Analysis of Gold for September 18,.2020 - Breakout of the rising wedge pattern in the background and potential for the downside movement

Prior €17.3 billion

  • Current account Seasonally Adjusted: 16.59 billion vs 20.69 prior

Slight delay in release Not a major focus now

Further Development
Analysis of Gold for September 18,.2020 - Breakout of the rising wedge pattern in the background and potential for the downside movement

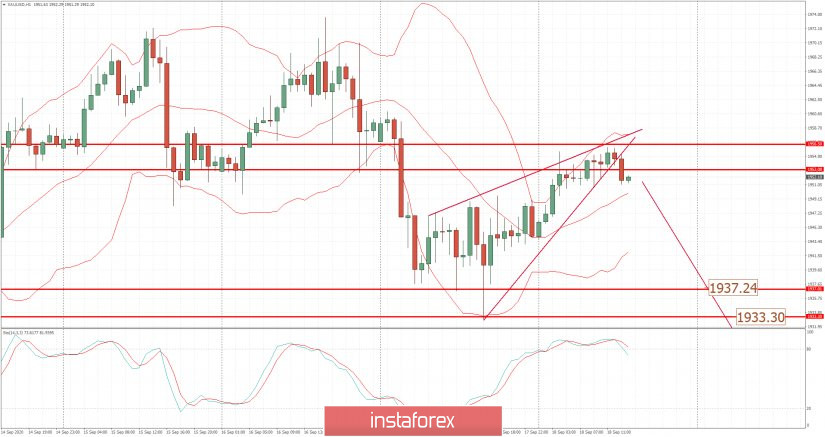
Analyzing the current trading chart of Gold, I found that there is the breakout of the triangle pattern in the background to the downside, which is good sign for the further lower prices.

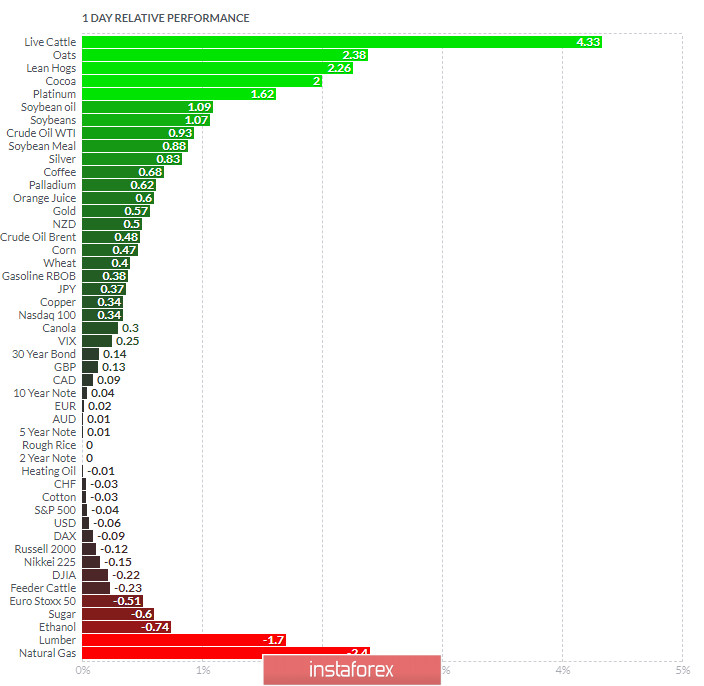
1-Day relative strength performance Finviz
Analysis of Gold for September 18,.2020 - Breakout of the rising wedge pattern in the background and potential for the downside movement

Based on the graph above I found that on the top of the list we got Live Cattle and Oats today and on the bottom Natural gas and Lumber.

Key Levels:

Resistance: $1,955

Support levels: 1,937 and $1,933

Analyst InstaForex
Share this article:
parent
loader...
all-was_read__icon
You have watched all the best publications
presently.
We are already looking for something interesting for you...
all-was_read__star
Recently published:
loader...
More recent publications...