


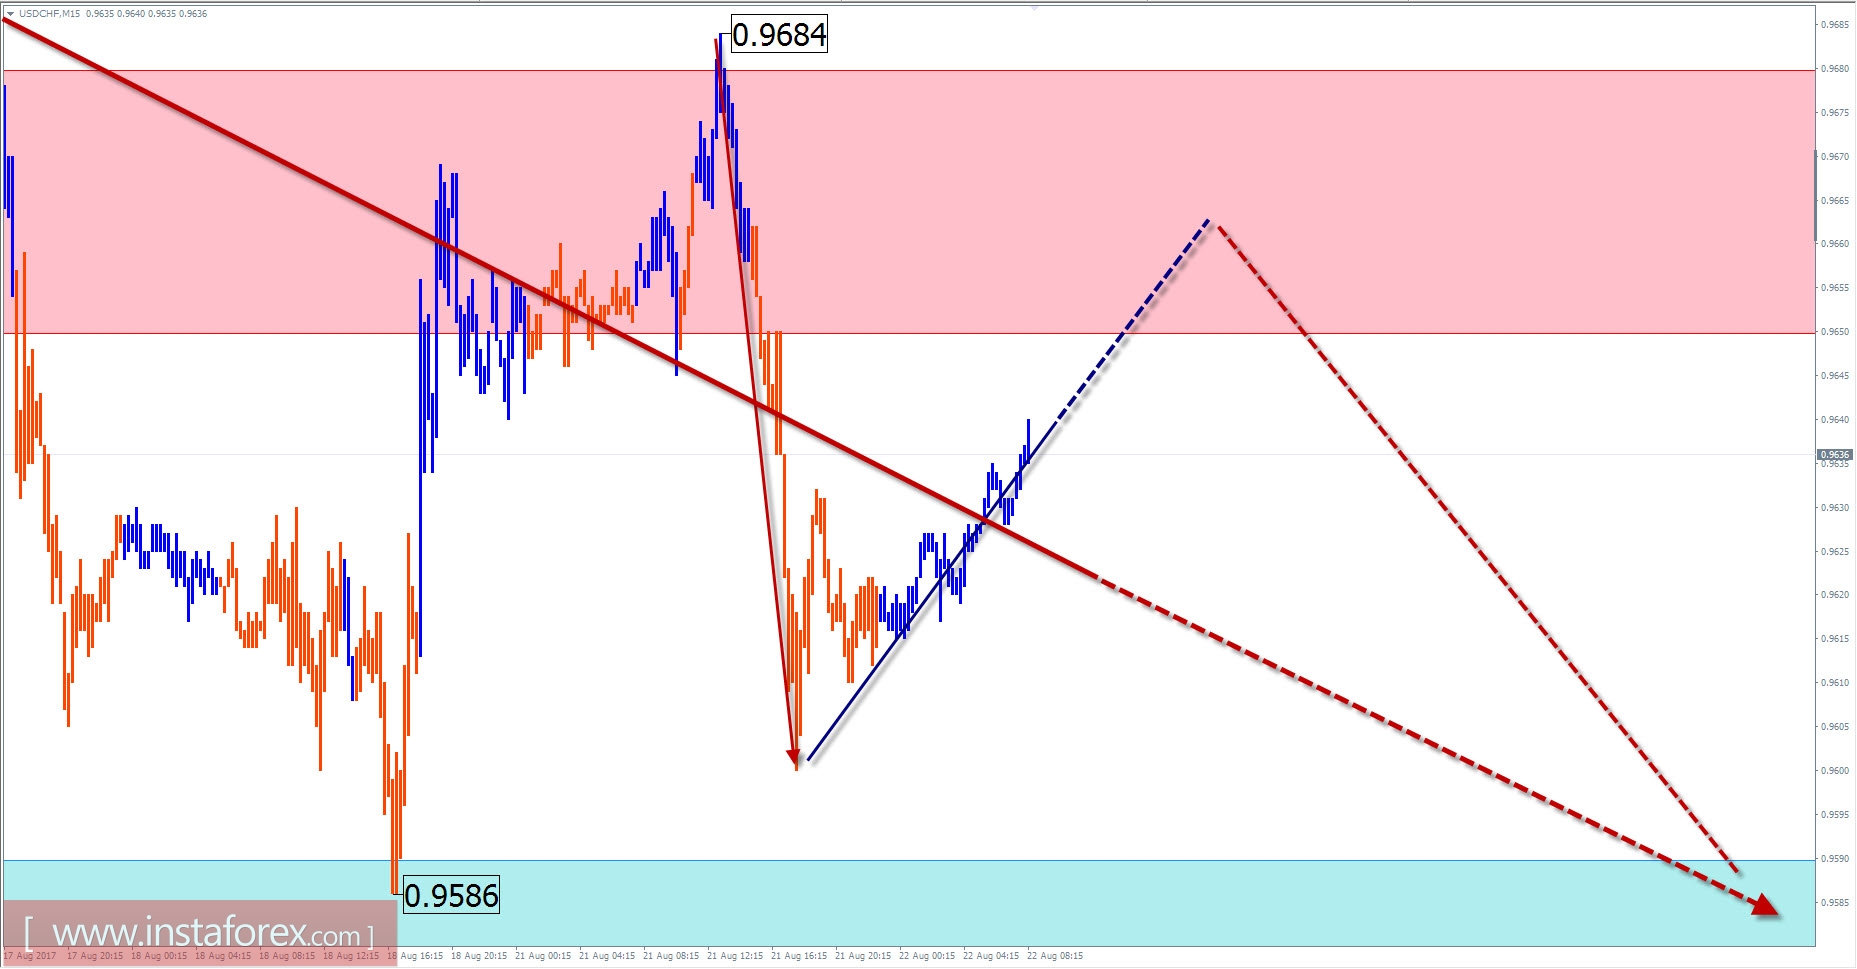
Overview of USD / CHF with a forecast for the current day
In the dominant on the chart of the major Swiss franc pair, the descending wave in recent months is forming a hidden correction. The wave has an irregular structure and is in the final phase. The most probable portion of the wave's completion is within the wide, potentially reversal zone. Its lower limit runs according to the level of local on August 8.
The last unfinished wave structure is a bullish zigzag of July 21. The entire current month has worked out the correcting part of the wave (B). The preliminary calculation gives the expectation of a move down in the area of the price figure.
Today, at the European session, the completion of an upcoming pullback within the resistance zone is expected. Further, it is expected that the exchange rate will change and the pair moves down. The limits of support will limit the day's running of the instrument.
The boundaries of the resistance zone:
- 0.9650 / 80
The boundaries of the support zone:
- 0.9590 / 60
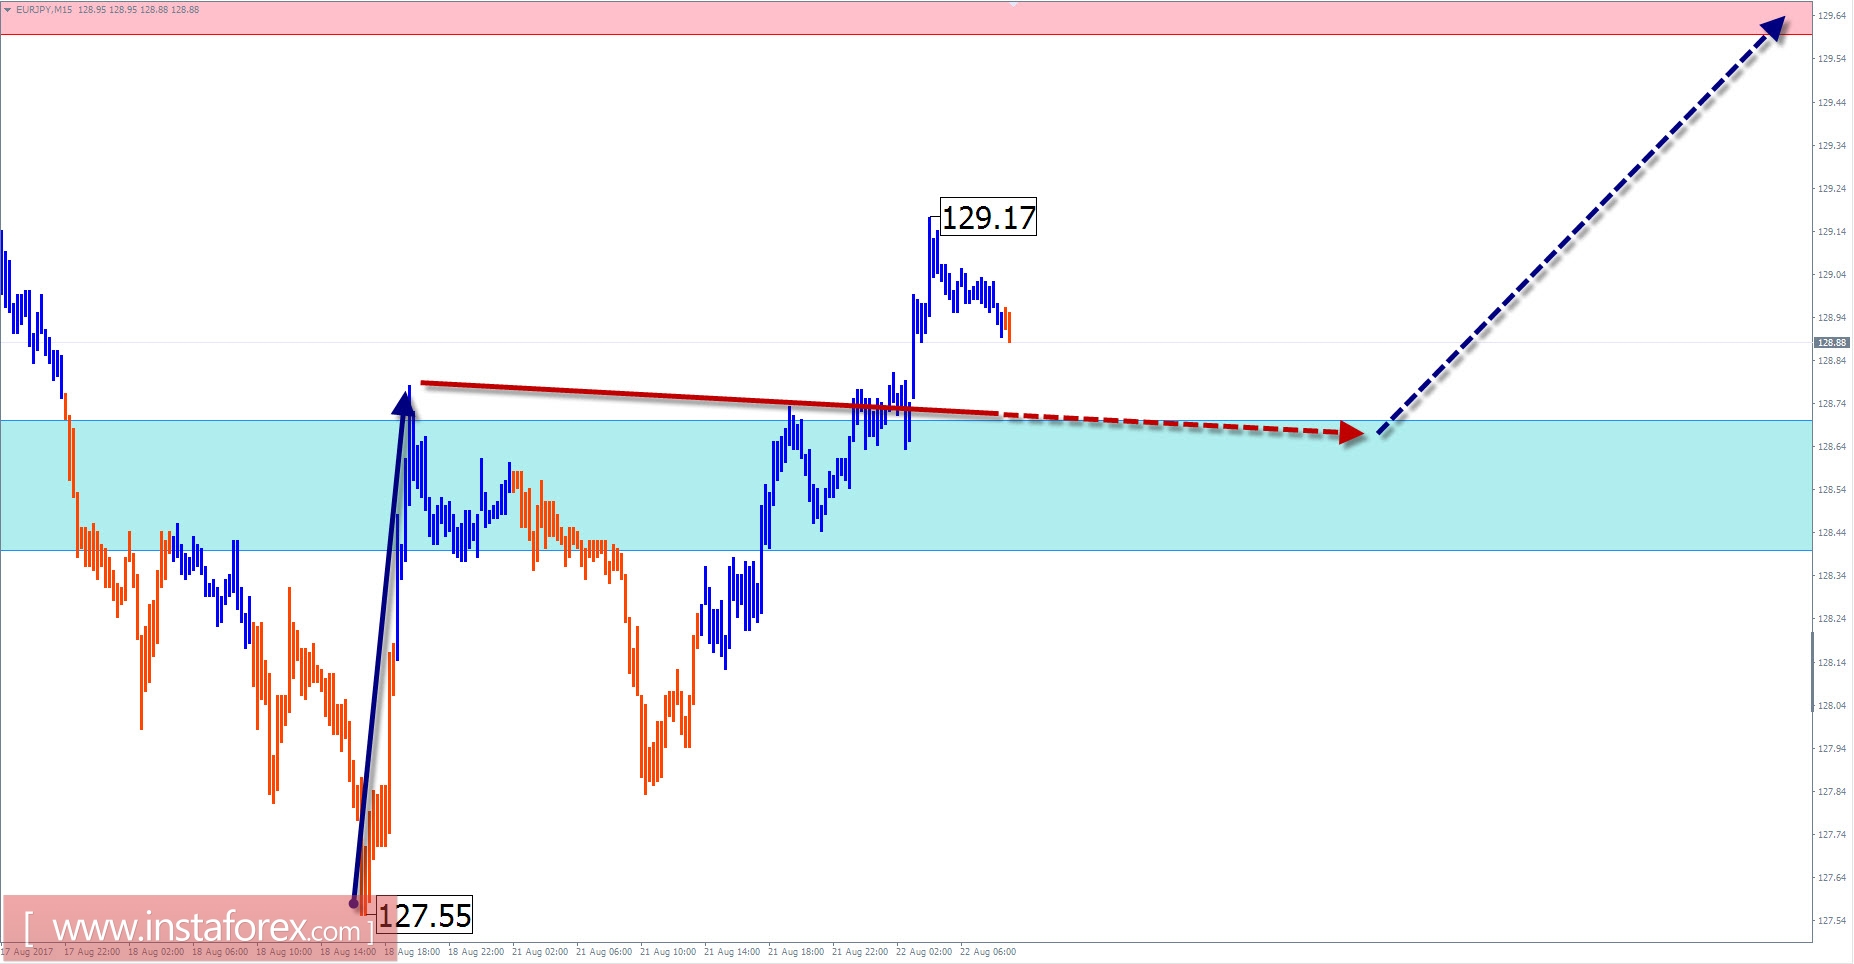
Overview of EUR / JPY with a forecast for the current day
On the euro / yen cross chart, the upward wave continues to develop, which sets the trend for the price movement since June last year. The current price zone creates resistance. This provoked the formation of a counter motion in the last 2 months. The structure of the correction is close to completion. The last portion of the wave (C), having an impulse character of motion, is corrected. Because of this, the downward wave is incorrect and stretched toward the main trend.
The preliminary calculation indicates a high probability of completion of the current decline in the area of the nearest reversal zone. Its upper edge is in the local low on August 18.
Today, a general upward movement is expected. In the morning, there may be a short-term decline, not beyond the support zone.
The boundaries of the resistance zone:
- 129.60 / 90
The boundaries of the support zone:
- 128.70 / 40
Explanations to the figures: For simplified wave analysis, a simple type of wave is used that combines 3 parts (A; B; C). Of such waves, all kinds of correction are composed and most of the impulses. On each considered time-frame the last, incomplete wave is analyzed.
The zones marked on the graphs are indicated by the calculation areas in which the probability of a change in the direction of motion is significantly increased. Arrows indicate the wave counting according to the technique used by the author. The solid background of the arrows indicates the structure formed, the dotted one indicates the expected wave motion.
Note: The wave algorithm does not take into account the duration of the tool movements in time. The forecast is not a trading signal! To conduct a transaction, you need to confirm the signals used by your trading systems.


