


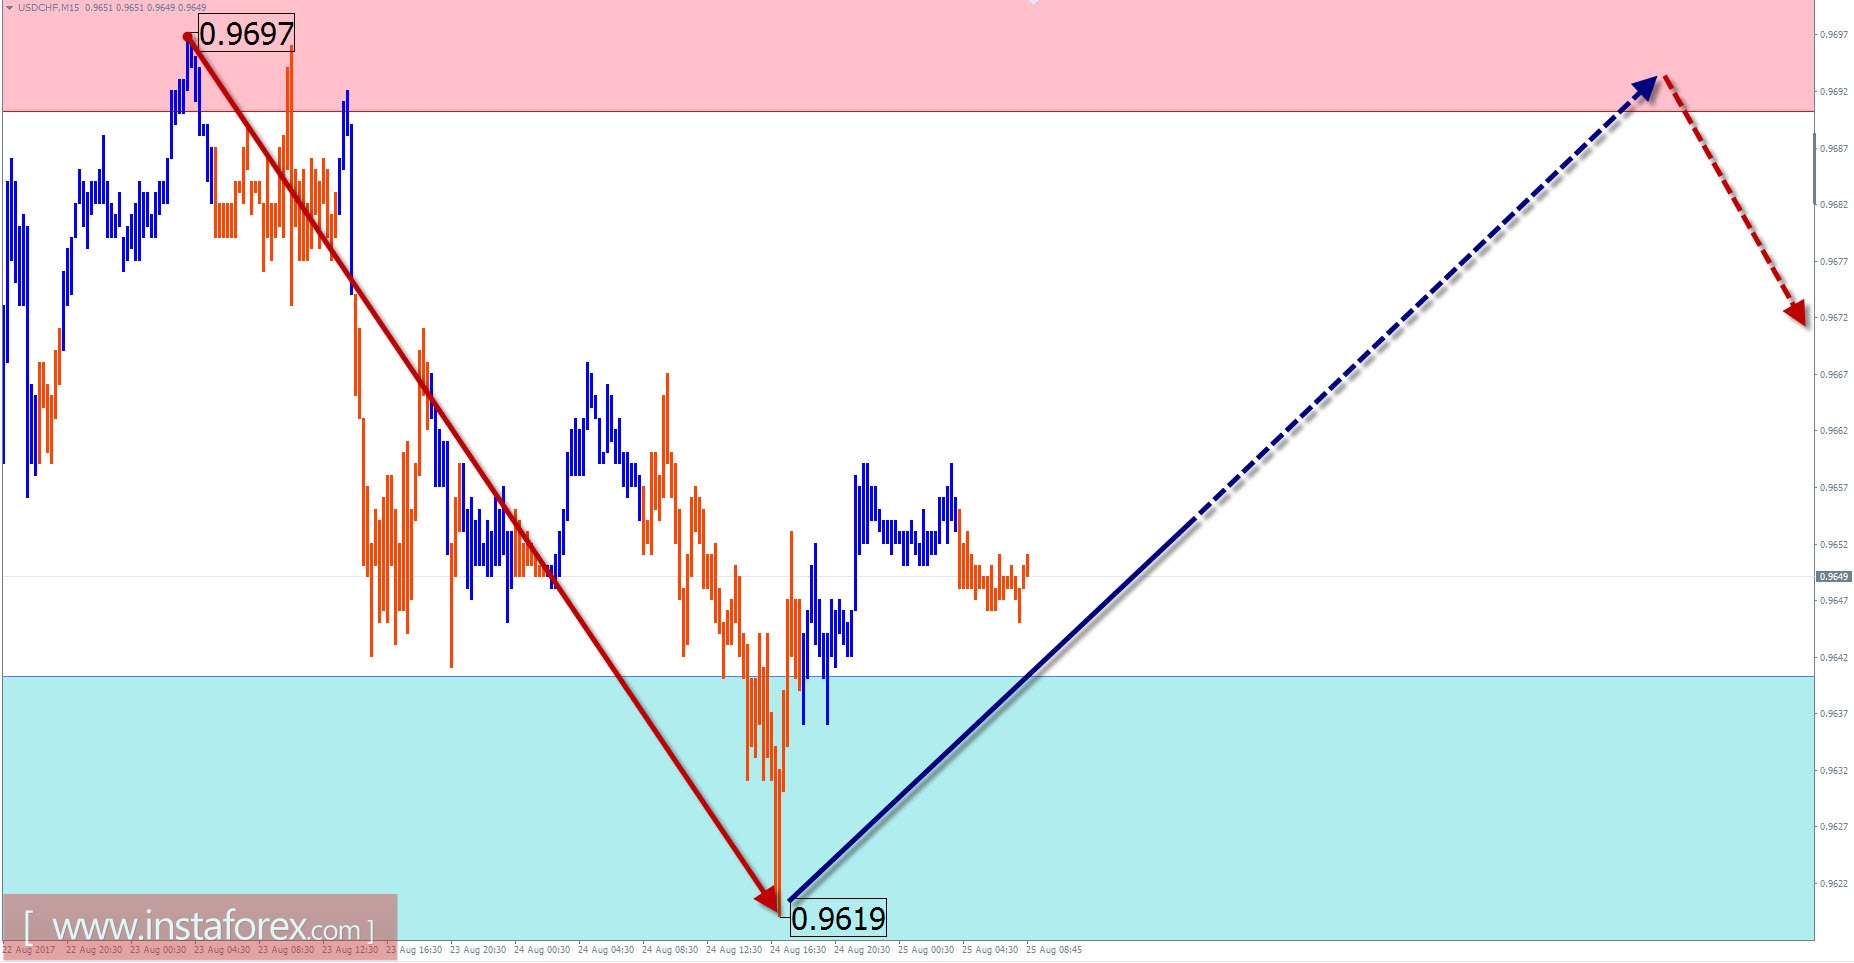
Overview of USD / CHF with a forecast for the current day
The direction of the trend for short-term movements in the price of the Swiss franc major is set by the downward wave of December 15. The reduction potential is not exhausted. The preliminary calculation allows you to expect the course of the pair, at least 5 price figures down from the current rate. The price zone reached at the end of July created the basis for a counter-rollback. The recovery potential is limited to the critical zone around the resistance level of a large scale.
Within the framework of an unfinished design, on July 21, in the last weeks, the middle part of the wave (B) is formed. Its structure for today is not completed.
Today, there is a high probability of the beginning of the growth rate. During the last days, flat was created on the chart for this suitable conditions. The preliminary pressure on the support is not ruled out. Increase in volatility is expected closer to the end of the day.
The boundaries of the resistance zones:
- 0.9690 / 0.9720
The boundaries of the support zones:
- 0.9640 / 10
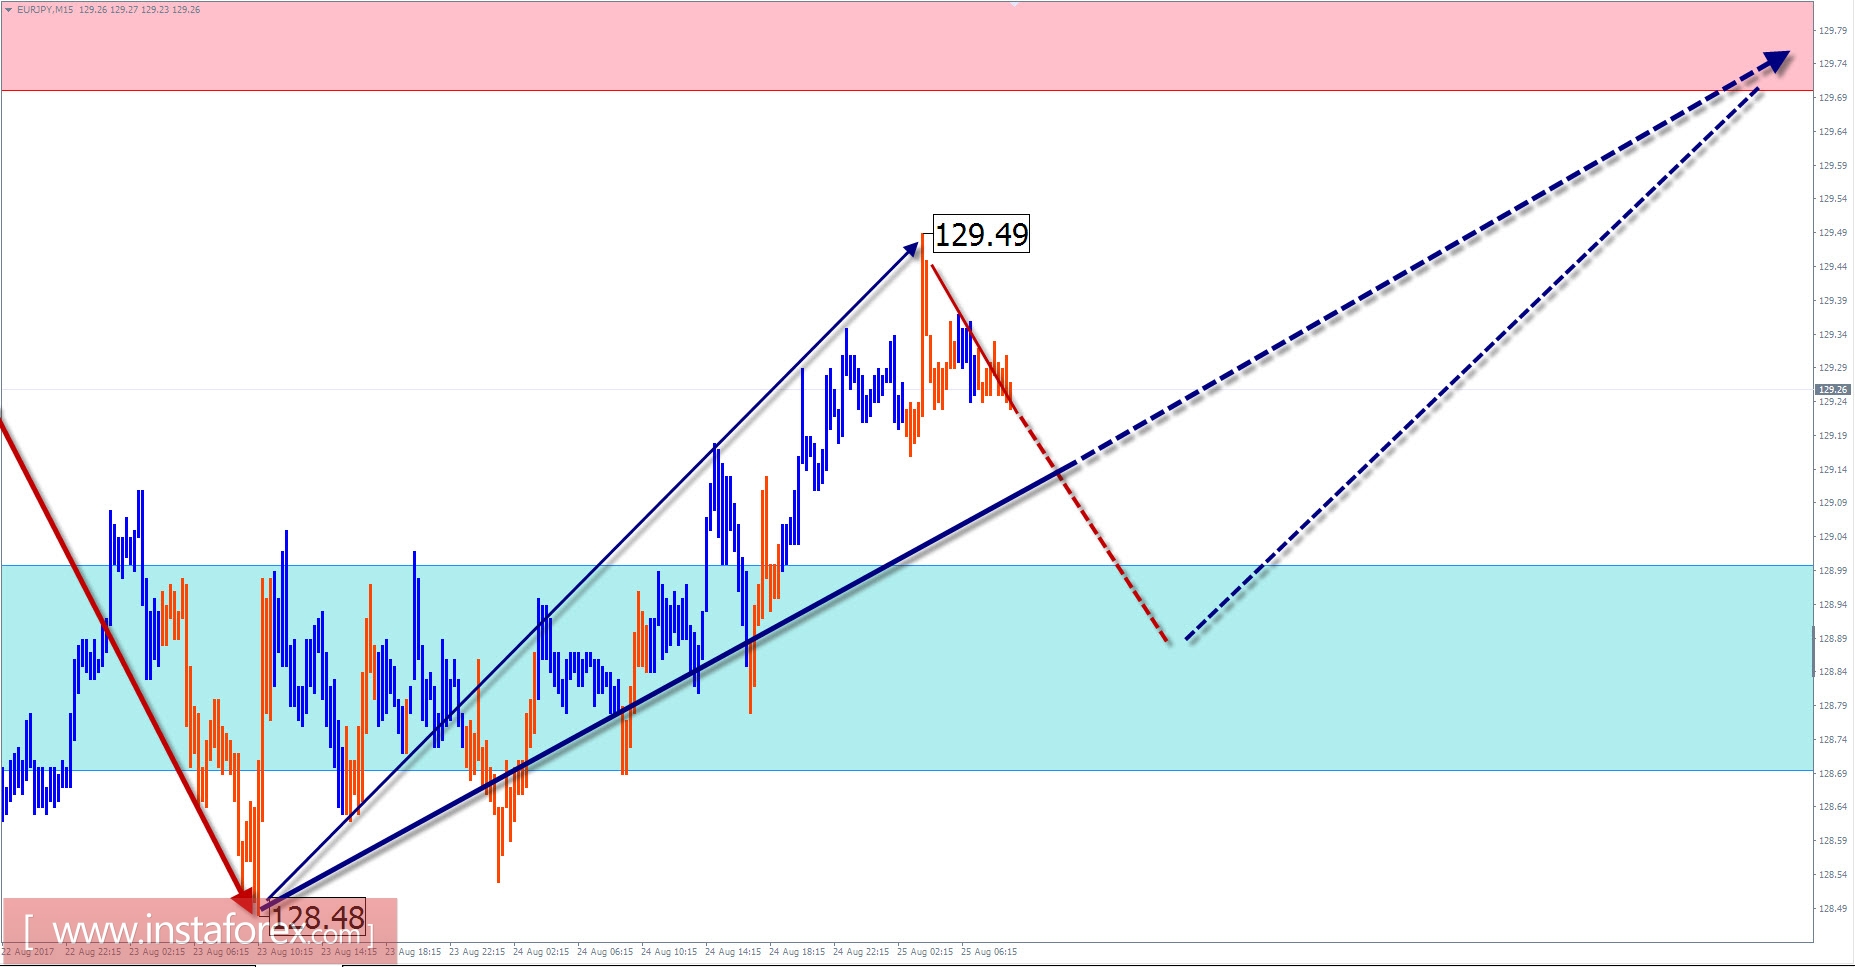
Overview of EUR / JPY with a forecast for the current day
The leading trend is the upward wave of the euro / yen cross reached the preliminary settlement completion zone. The structure of the entire wave for today does not show completeness. On the chart, there are no reversal signals. Moreover, there are clear signs of the continuation of the current wave. Continuing in recent months, "outset" forms an intermediate latent correction, necessary to increase the wave level of the current trend.
Beginning in the first decade of August, the ascending zigzag resembles the reversal construction preceding the change in the weekly exchange rate of the pair.
Today, in the morning, we are expecting a flattened mood with a descending vector. Further, in the area of the support zone, you need to wait for a change in the course. The active phase of growth is likely at the end of the day or at the beginning of the next trading week.
The boundaries of the resistance zones:
- 129.70 / 130.00
The boundaries of the support zones:
- 129.00 / 128.70
Explanations to the figures: For simplified wave analysis, a simple type of wave is used that combines 3 parts (A; B; C). Of such waves, all kinds of correction are composed and most of the impulses. On each considered time-frame the last, incomplete wave is analyzed.
The zones marked on the graphs are indicated by the calculation areas in which the probability of a change in the direction of motion is significantly increased. Arrows indicate the wave counting according to the technique used by the author. The solid background of the arrows indicates the structure formed, the dotted one indicates the expected wave motion.
Attention: The wave algorithm does not take into account the duration of the tool movements in time. The forecast is not a trading signal! To conduct a transaction, you need to confirm the signals used by your trading systems.


