


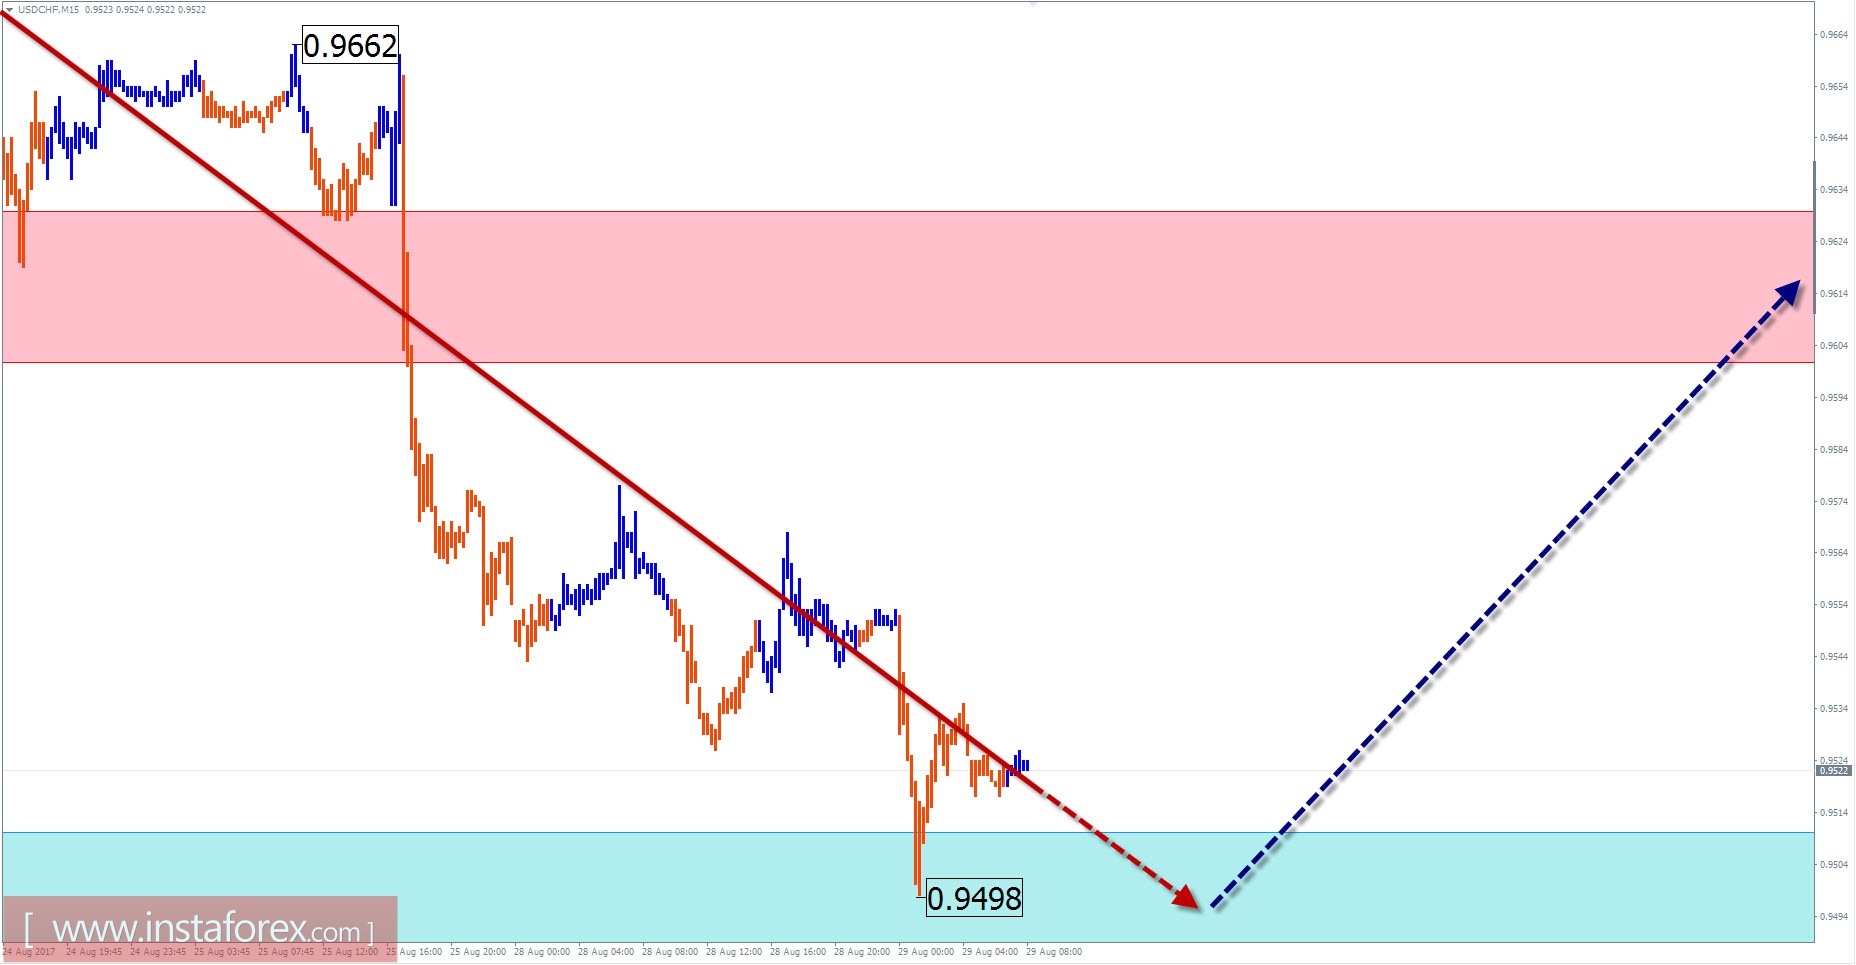
USD / CHF review with current day forecast
The dominant trend of the USD/CHF major pair was formed within the framework of the global wave structure formed on a weekly chart scale. This bearish wave, being counted since last December, has not been completed for today. In its structure, an interim correction has been closed in its structure from observers over the recent months.
At this time, a strong level of support in the price segment was reached. In the near future, when the price approaches the zone, it will trigger an upward rollback.
In the upcoming trading sessions, the downward mood is expected to end while there will be a formation of reversal and begin the course of recovery. The calculated resistance zone demonstrates the expected target level of the upcoming recovery.
Boundaries of resistance zones:
- 0.9510 / 0.9480
Support zone boundaries:
- 0.9600 / 0.9630
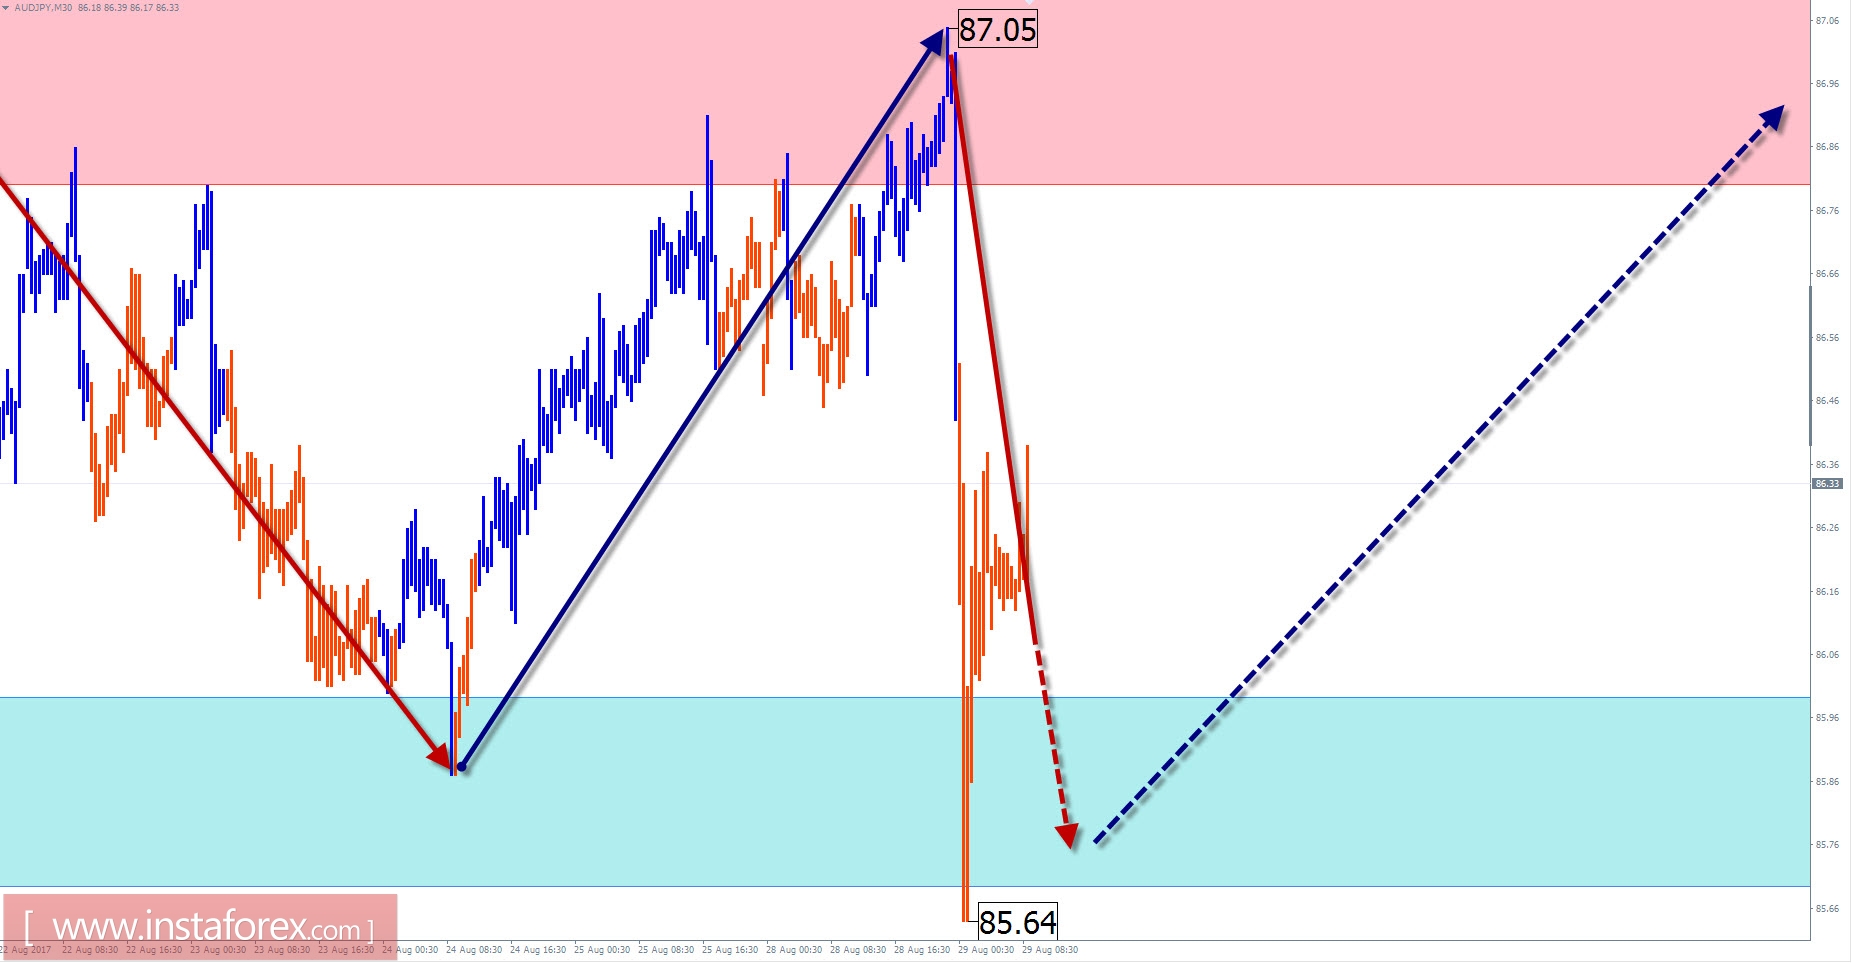
Overview of AUD / JPY with the forecast for the current day
The structure of an upward short-term wave of the Australian dollar was fully formed as it crossed the yen. The proportions of the wave parts were met and the preliminary lifting targets were reached. The several simultaneous conditions that coincidentally occurred, served as the basis for considering the current wave of the upward trend of the instrument completed. The beginning of the bearish wave allows the assumption of the wave level formation on the chart, at least the correction from the previous rise.
The prediction of the change in course was complemented by the oncoming reversal construction that has begun. The wave section of August 11 formed the correctional part (B).
Today, the current 2 weeks "outset" is expected to continue.
Boundaries of resistance zones:
- 86.80 / 87.10
Support zone boundaries:
- 86.00 / 85.70
Explanations to the figures:
For simplified wave analysis, a simple waveform is used that combines 3 parts namely A, B, and C. All types of correction are created and most of the impulses can be found in these waves.
The zones marked on the graphs indicate the probability of a change in the direction of motion has significantly increased as calculated in the areas. Arrows indicate the wave counting following the technique used by the author. A solid background of the arrows signifies the structure has been formed while the dotted one means the expected wave motion.
Attention: The wave algorithm does not take into account the duration of the movement of tools in time. The forecast is not a trading signal! To conduct a bargain, you need to confirm the signals used by your trading systems.


