Main Quotes Calendar Forum
flag

FX.co ★ Ichimoku cloud indicator Daily analysis of Gold

parent
Forex Analysis:::2020-09-24T13:27:08

Ichimoku cloud indicator Daily analysis of Gold

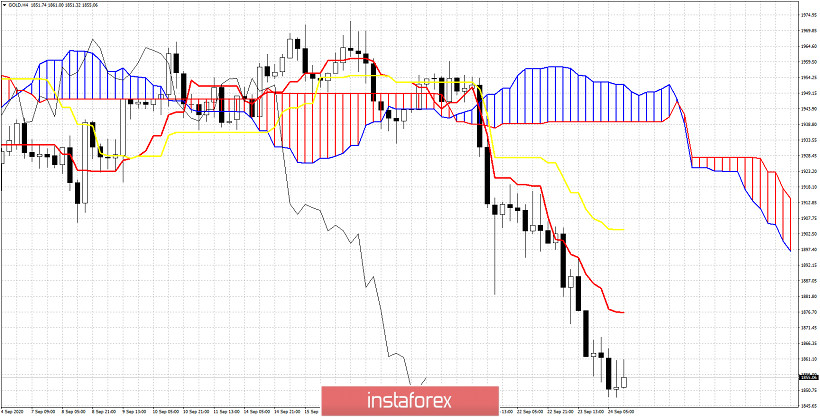
Gold price remains in a short-term bearish trend making lower lows and lower highs. Today we use the Ichimoku cloud indicator in order to identify key support and resistance levels and to see what needs to be done in order for trend to change.

Ichimoku cloud indicator Daily analysis of Gold

Price is below both the tenkan-sen (red line indicator) and the kijun-sen (yellow line indicator). This is bearish. Resistance by the tenkan-sen and kijun-sen is at $1,876 and $1,904. The Chikou span (black line indicator) is below the candlestick pattern. The 4 hour Kumo is red. All signs confirm bearish trend. Bulls need to move price above the tenkan-sen first in order to hope for a move towards the kijun-sen and the cloud. Until then we expect lower lows.
Analyst InstaForex
Share this article:
parent
loader...
all-was_read__icon
You have watched all the best publications
presently.
We are already looking for something interesting for you...
all-was_read__star
Recently published:
loader...
More recent publications...