


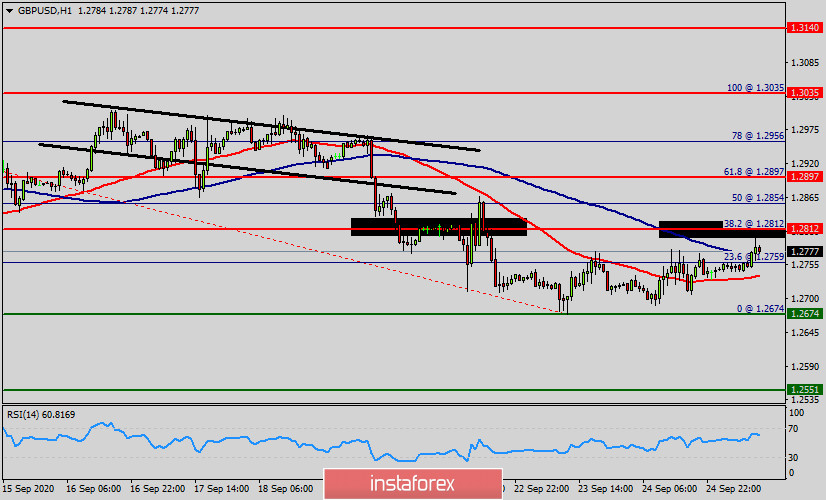
The GBP/USD pair continues to move downwards from the level of 1.2897. this week, the pair dropped from the level of 1.2897 to the bottom around 1.2674. But the pair has rebounded from the bottom of 1.2674 to close at 1.2774.
Today, the first support level is seen at 1.2674, the price is moving in a bearish channel now. Furthermore, the price has been set below the strong resistance at the level of 1.2812, which coincides with the 38.2% Fibonacci retracement level.
This resistance (1.2812) has been rejected several times confirming the veracity of a downtrend. Additionally, the RSI starts signaling a downward trend.
As a result, if the GBP/USD pair is able to break out the first support at 1.2759, the market will decline further to 1.2674 in order to test the weekly support 1 again.
Consequently, the market is likely to show signs of a bearish trend. So, it will be good to sell below the level of 1.2812 with the first target at 1.2674 and further to 1.2551.
On the other hand, in case a reversal takes place and the GBP/USD pair breaks through the resistance level of 1.2897, then the best slution to set your stop loss at the level of 1.2920.
Overall, we still prefer the bearish scenario which suggests that the pair will stay below the zone of 1.2897/1.2812 today.


