


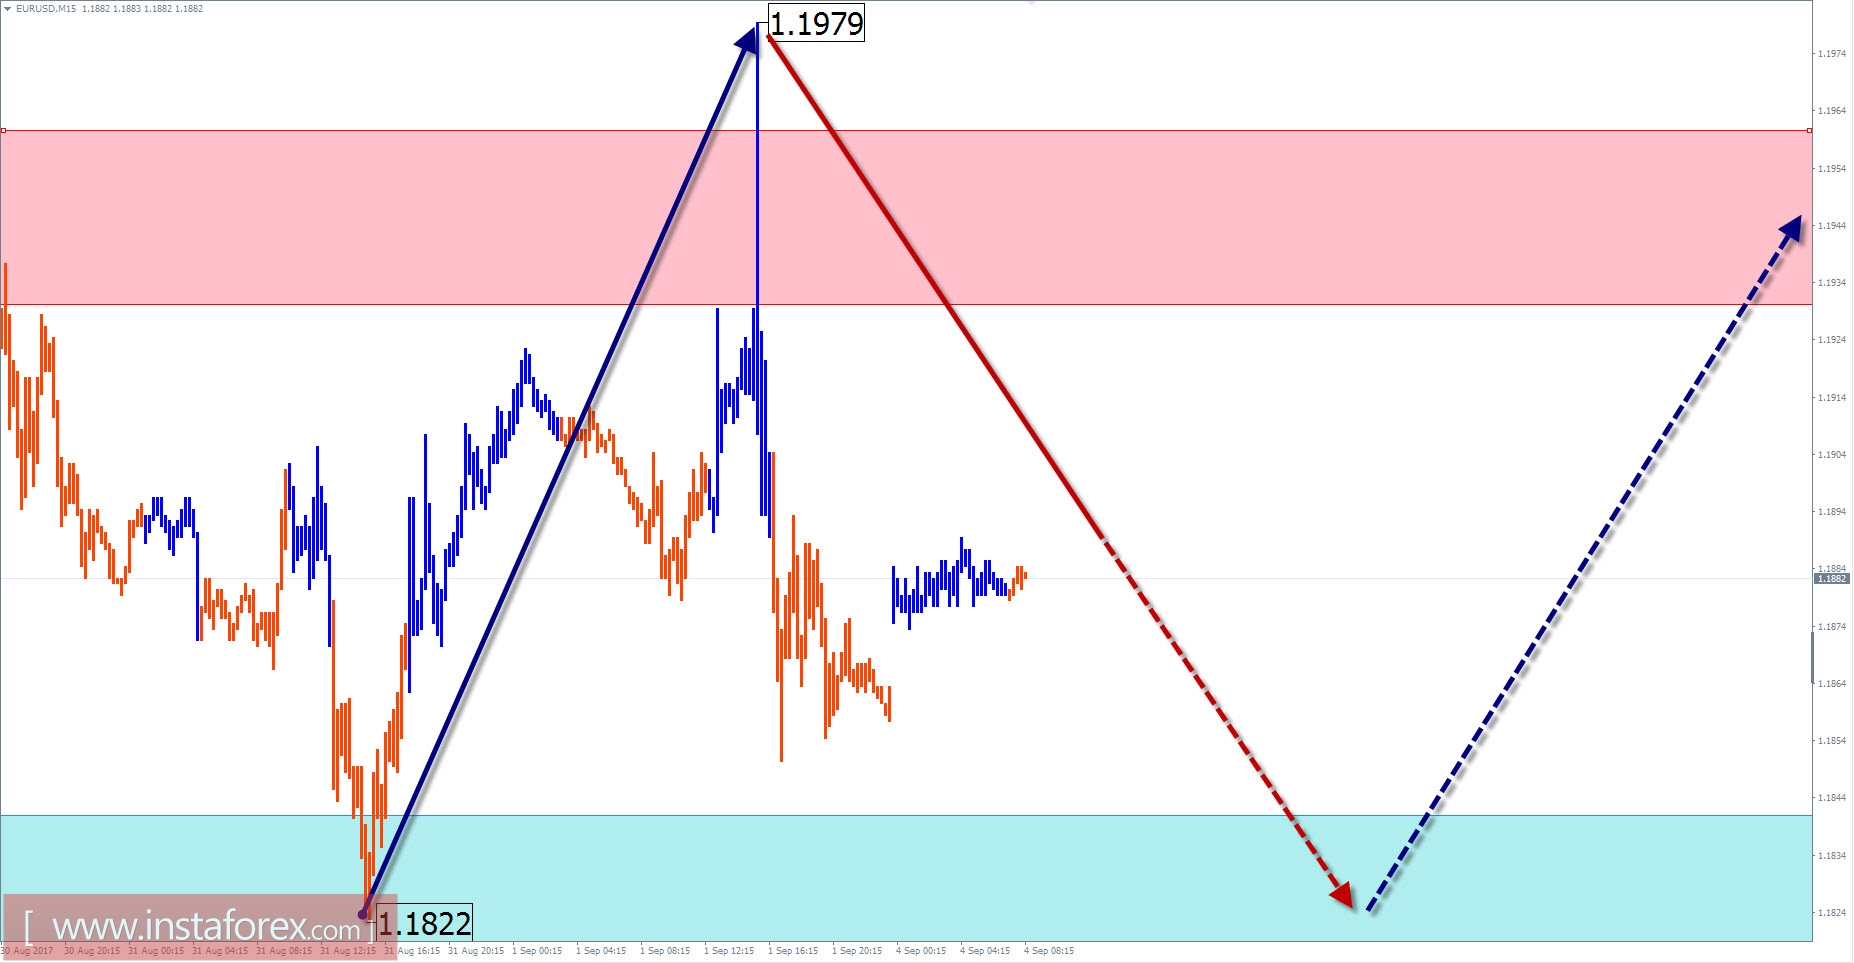
EUR / USD outlook for the current day
Since March 2015, the chart of the major pair of the single European currency has formed an expanded flat. If we draw through the extreme of the line, the figure of "expanding triangle" will be formed. The wave analysis structure of this section shows the end proximity of the entire pattern. The price of the pair is near the bottom of the next potential reversal zone, capable of completing the current wave model.
The decline that began last week in its wave level has exceeded the potential of a simple pullback. With a high level of probability, this is the beginning of the reversal zigzag, preceding the change in the inter-week trend.
Today, the possible scenario of the price movement is the lateral attitude. The downward vector is more likely to happen in the morning. Closer to the end of the day, the potential to change the session trend will increase. The increase of the pair's rate within the limits of the channel will limit the resistance zone.
Boundaries of resistance zones:
-1.1930 / 60
Boundaries of support zones:
-1.1840 / 10
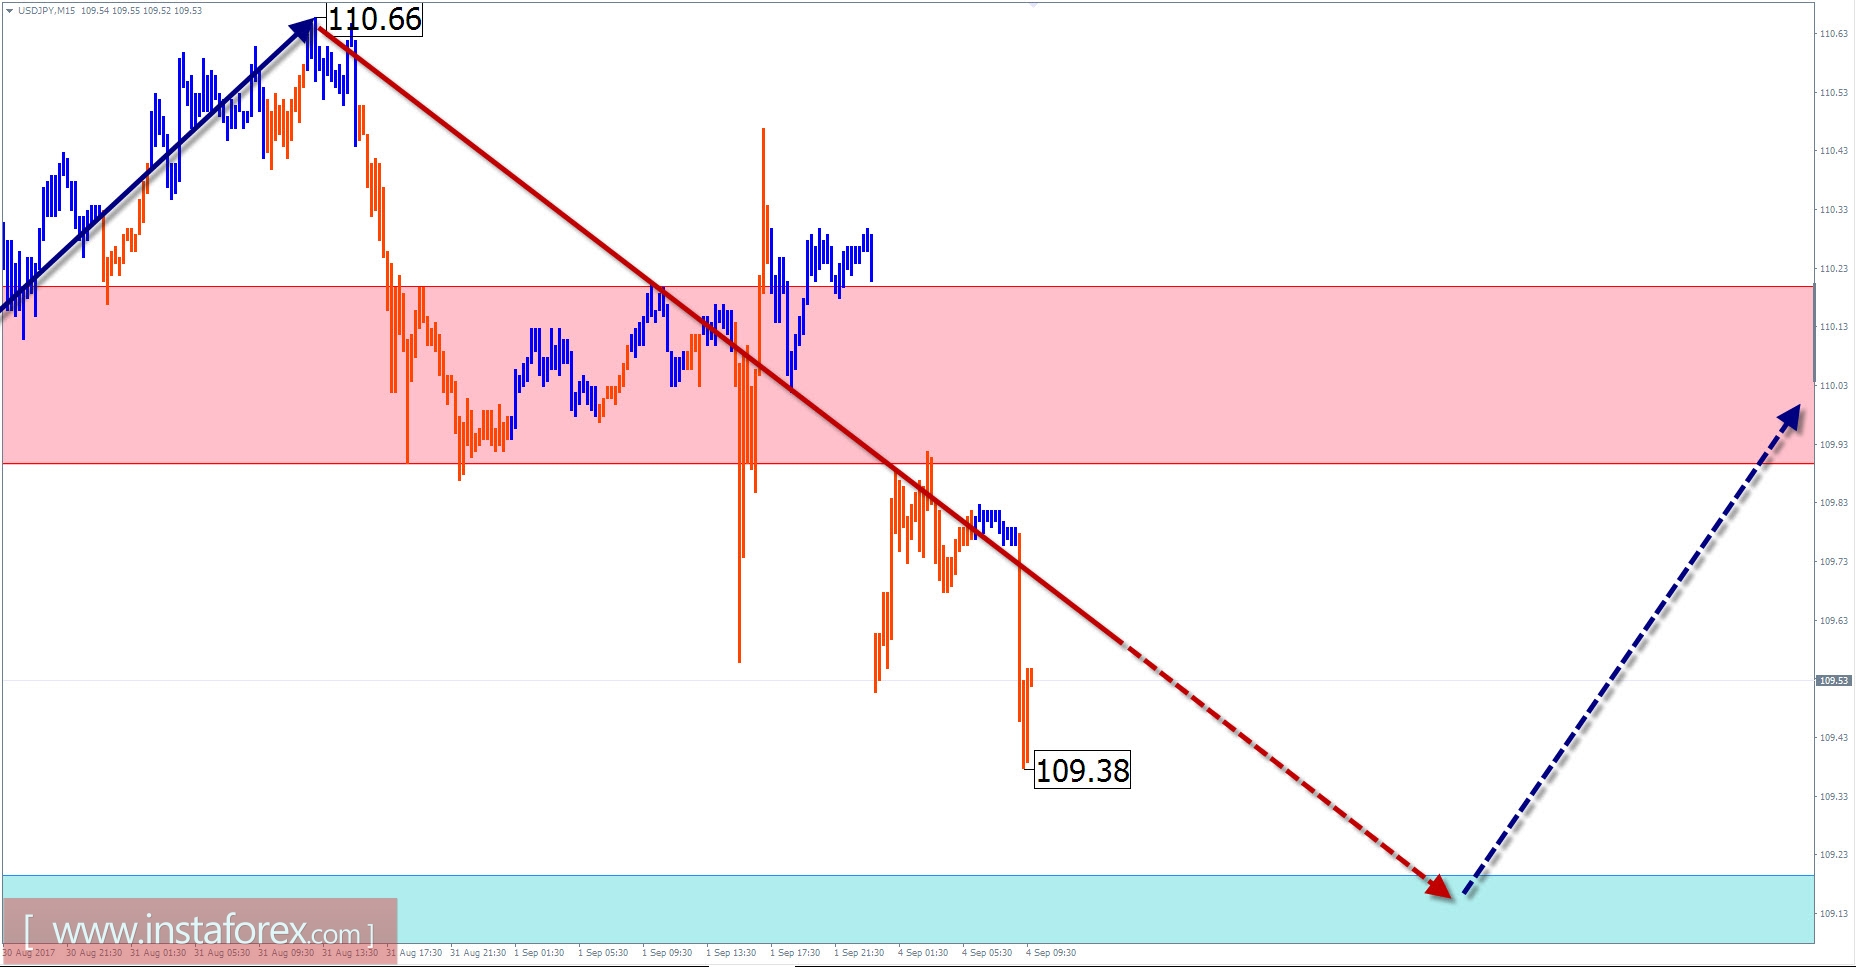
USD / JPY outlook for the current day
The incomplete wave structure in the short-term time scale on the major chart of the yen has been included since the end of June last year. The counter price movement in the current year forms the corrective part (B). Some indications show that the wave of correction is approaching the final part. There are no hints whether there are some changes in direction, but the minimum reduction targets were already accomplished.
Forming the direction of inter-trend movements, the last section started on July 11. The second half of August shown in the chart proved to be more flat due to the corrective ascending segment.
Today, the nearest trading session is expected to end the decline that started at the end of last week. The completion and the formation of the reversal are possible in the support area. The beginning of the recovery phase is actually near the end of the day or tomorrow.
Boundaries of resistance zones:
- 109.90 / 110.20
Boundaries of support zones:
- 109.20 / 108.90
Explanations to the figures: For simplified wave analysis, a simple waveform is used that combines 3 parts (A; B; C). Of these waves, all kinds of correction are composed mostly of the impulses. On each considered time frame, the last and incomplete wave is analyzed.
The areas marked in the graphs are indicated by the calculation areas in which the probability of change in the direction significantly increased. Arrows indicate the wave counting according to the technique used by the author. The solid background of the arrows indicates the formed structure, the dotted one indicates the expected wave motion.
Attention: The wave algorithm does not take into account the duration of tool movements in time. The forecast is not a trading signal! To conduct a trade transaction you need confirmation signals used by your trading systems.


