


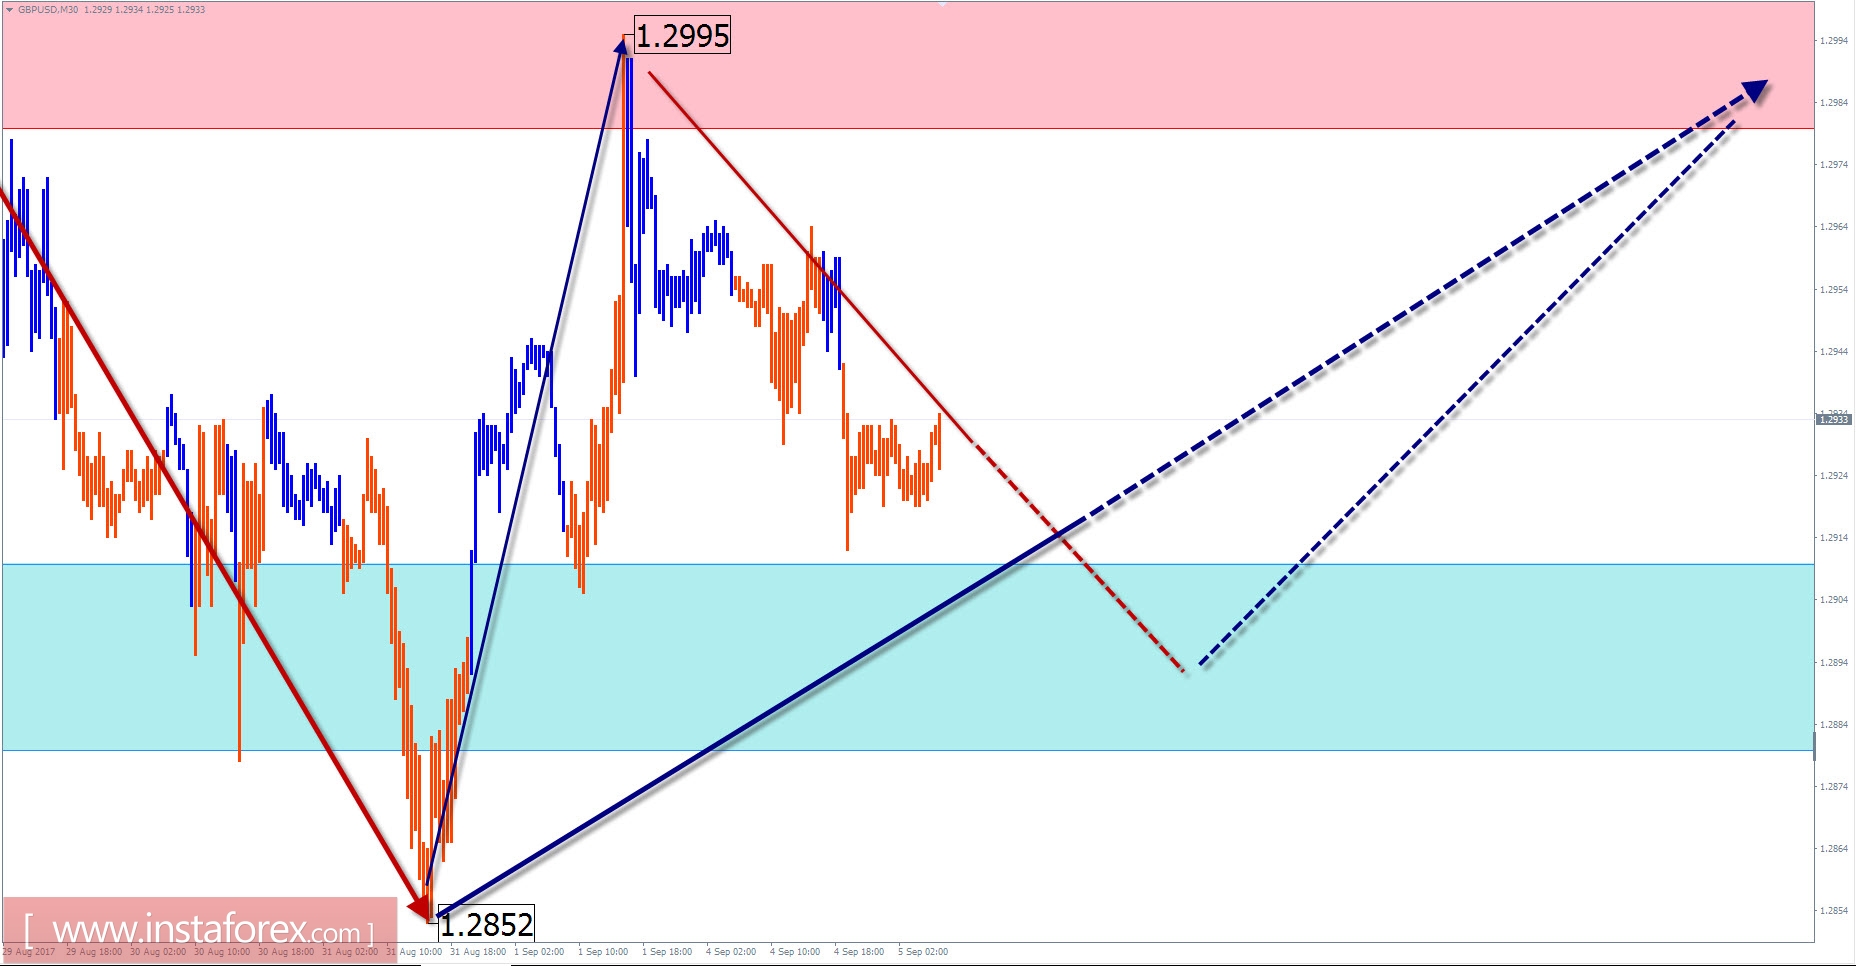
GBP/USD outlook for the current day
The ascending wave that dominated the chart of the pound sterling led the pair's price to reach the lower limit of the potential reversal zone. Earlier this month, this caused changes in the course of the inter-week trend.
The initial estimate of the stroke potential is expected to move down about 3 price figures from the current level. The descending wave at the time of analysis is in the process of forming a corrective lift. In the local high area on September 1, the calculated area begins, where the probability of completing the correction significantly increased.
Today, during the latest trading session remains a high chance of completing the downward rollback. The short-term puncture of the lower boundary in the support zone cannot be ruled out. Ultimately, you can rely on the changes in the trading course. The daily price growth is expected not higher the resistance zone.
Boundaries of resistance zones:
- 1.2980 / 1.3010
Boundaries of support zones:
- 1.2910 / 1.2880
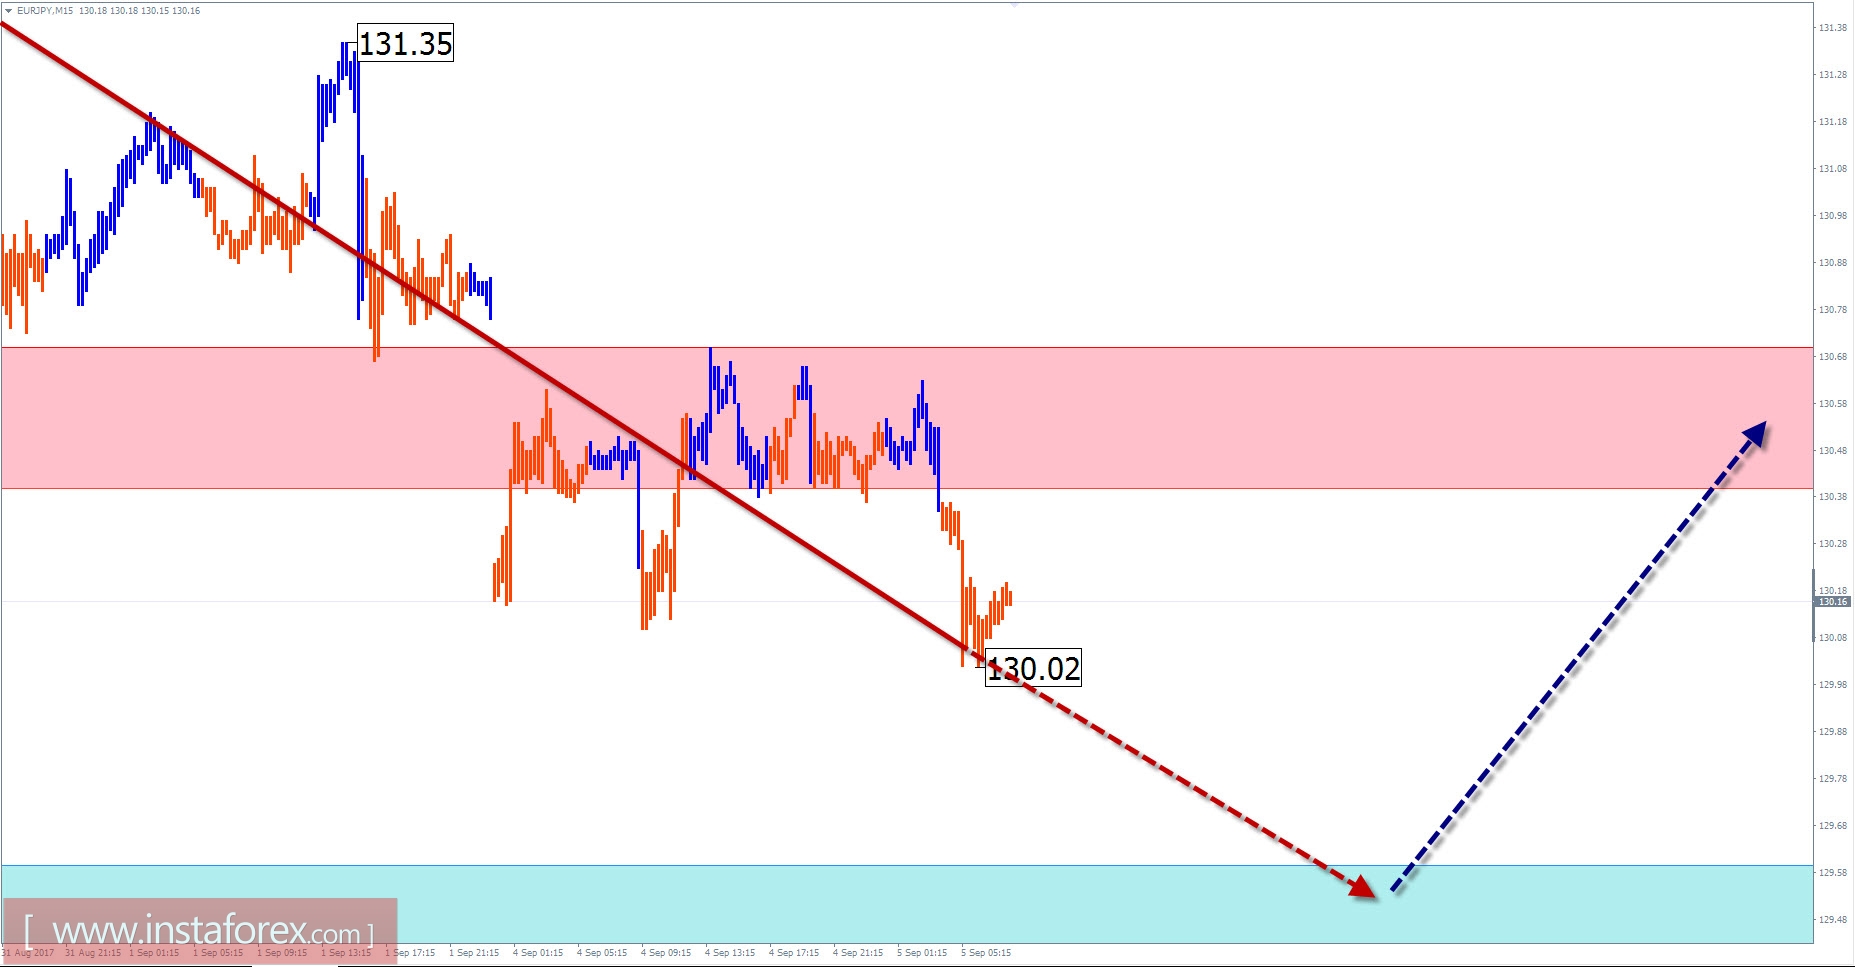
EUR/JPY outlook for the current day
Since June 2016, the graph of the cross pair euro-yen is dominated by an upward trend. Heading through the short-term trend, the wave has increased its level which indicates additional target for growth. The preliminary estimated marked the 139th price figure with the lower limit of the potential reversal area.
For the last two months, the pair moved through the sideways trend. The price is in the zone of a strong level, which has created resistance to the current price hike. This triggered the formation of the hidden correction structure on this area that ended two weeks ago. The price hike from August 18 indicates a new bullish wave.
Today, the possible price reduction continues, moving up to reach the support region. A reversal and the opening of another trading session are possible towards the end of the day. An active growth period is expected tomorrow.
Boundaries of resistance zones:
- 130.40 / 70
Boundaries of support zones:
- 129.60 / 30
Explanations to the figures: For simplified wave analysis, a simple waveform is used that combines 3 parts (A; B; C). Of these waves, all kinds of correction are composed mostly of the impulses. On each considered time frame, the last and incomplete wave is analyzed.
The areas marked in the graphs are indicated by the calculation areas in which the probability of change in the direction significantly increased. Arrows indicate the wave counting according to the technique used by the author. The solid background of the arrows indicates the formed structure, the dotted one indicates the expected wave motion.
Attention: The wave algorithm does not take into account the duration of tool movements in time. The forecast is not a trading signal! To conduct a trade transaction you need confirmation signals used by your trading systems.


