


Overview :
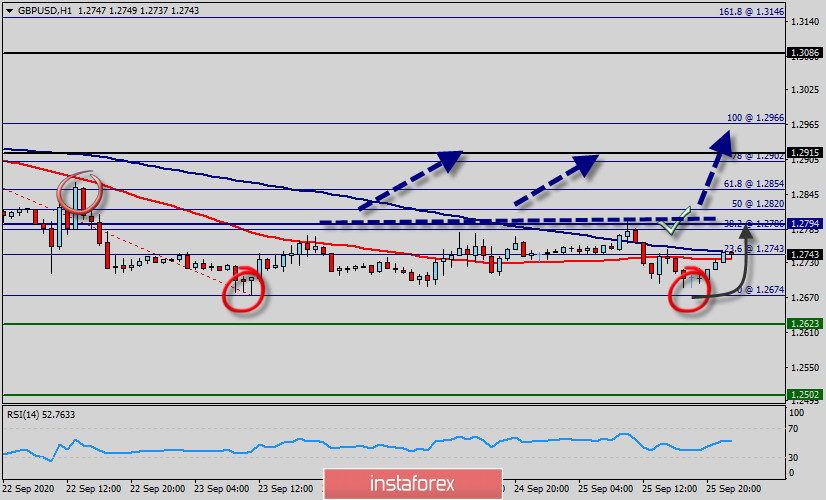
The GBP/USD pair is showing signs of indecision at the bottom lip of a key support range between 1.2674 and 1.2743. The pair also discontinued around these levels last week (from 21st September to 25th September of 2020).
The GBP/USD pair has dropped down in order to bottom at the point of 1.2674. But it has climbed along a steep, upward-sloping support channel from the bottom to close at the price of 1.2743. The GBP/USD pair rose at an even more ambitious incline.
We expect to see a strong reaction off this level to push price up towards 1.2794 in order to test the weekly pivot points. The GBP/USD pair continues moving in a bullish trend from the newest support levels of 1.2743 and 1.2674.
Currently, the price is in a bullish channel. Accordingly, we foresee That the price is going to test major resistance at 1.2794 (38.2% of Fibonacci retracement, bullish bar - pivot).
RSI (14) sees major descending support line acting as support to push price up from here. Saturation state in the area of 1.2674 - 1.2700.
On four-hour chart :
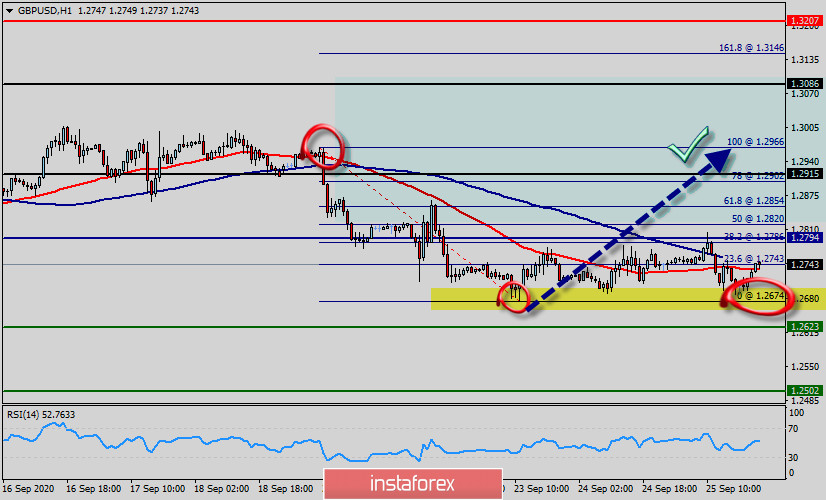 From this point, the GBP/USD pair will be probably continued in a bullish trend from the new support of 1.2743. According to the previous events, we expect the GBP/USD pair to trade between 1.2743 and 1.2915.
Resistance is seen at the levels of 1.2794 and 1.2915. Also, it should be noticed that, the level of 1.2794 represents the daily pivot point.
Therefore, strong support will be formed at the level of 1.2794 providing a clear signal to buy with the targets seen at 1.2915.
If the trend breaks the resistance at 1.2794 , the pair will move upwards continuing the development of the bullish trend to the level 1.2915 in order to test the daily resistance 1 and try to hit the next objective 1.3086.
On the other hand, in case a reversal takes place and the GBP/USD pair breaks through the support level of 1.2623, a further decline to 1.2502 can occur which would indicate a bearish market.
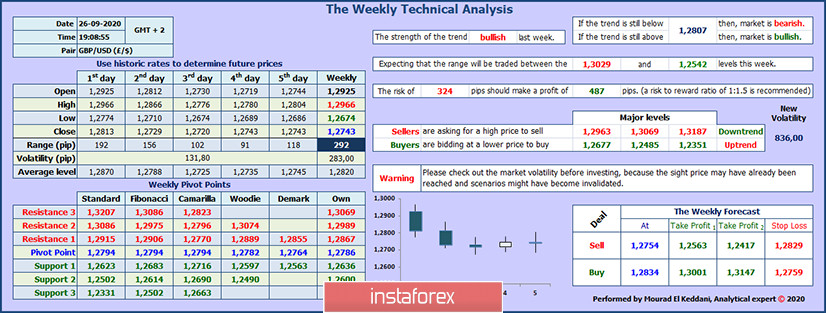
Statistics and Forecast :
- Last Trend : Downtrend - Strong
- Next Trend (forecast) : Bounce to uptrend - Moderate.
- Last Range : 292 pips.
- Next Range (forecast) : from 1.2625 to 1.3086 (461 pips).
Daily Classical Pivot Points :
- Resistance 3 : 1.3207
- Resistance 2 : 1.3086
- Resistance 1 : 1.2915
- Pivot Point : 1.2794
- Support 1 : 1.2623
- Support 2 : 1.2502
- Support 3 : 1.2331


