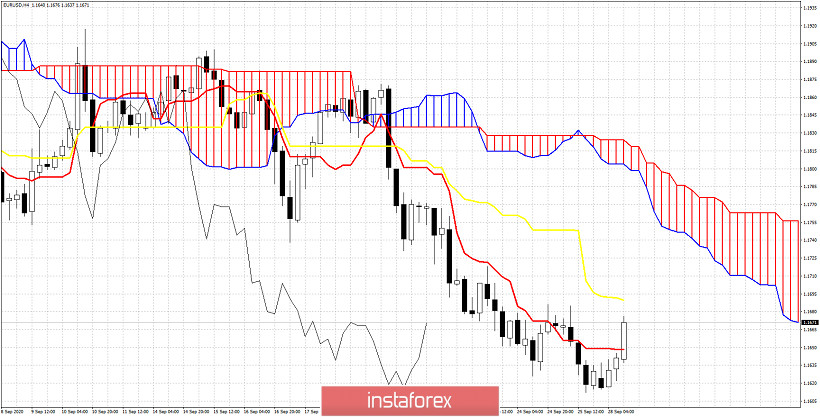
EURUSD made a low at 1.1612 when our target for some time now has been the 1.16 level. Price is now bouncing at 1,1670 and there are signs of a bigger bounce or trend reversal coming. We use the Ichimoku cloud indicator in order to identify key resistance and support levels.

Trend in the 4 hour chart remains bearish as price remains below the cloud at 1.18. The Chikou span (black line indicator) is below the candlestick pattern. This is a bearish sign. Resistance according to the Chikou span is at 1.1720. Price is now moving above the tenkan-sen (red line indicator) and is heading towards the next short-term resistance at the kijun-sen at 1.1692. So we can confirm that the 1.1690-1.1720 is resistance area Breaking above it will open the way for a stronger bounce towards the Kumo (cloud) at 1.18. Support is found at the recent low at 1.1612 and at the tenkan-sen at 1.1648. If price turns below 1.1648, the chances of breaking below 1.16 increase dramatically. For now we expect price to challenge the 1.1690-1.1720 resistance area.


