


XAU/USD has printed a minor double bottom pattern on the H4 chart announcing a strong upside momentum. The pattern was confirmed by today's high of $1,887 level, but the pressure remains high as the rate is located below strong upside obstacles.
Gold has invalidated a larger drop and it could continue to move in a range in the upcoming period. Today, the US data and the FOMC member's speeches could shake the markets. The global risk and uncertainty are high, so a risk rally could be activated anytime again. A brutal second COVID-19 wave could attract more and more buyers on the yellow metal again.
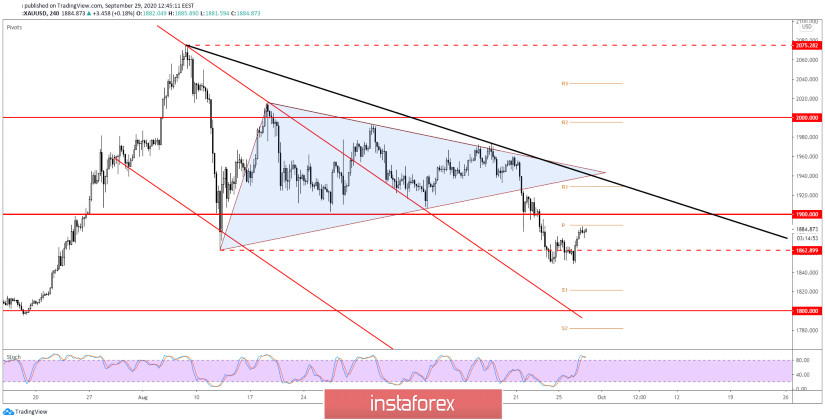
XAU/USD rebounded from below $1,862 static support and now is almost to hit the Pivot Point ($1,888) static resistance. Technically, the rate was somehow expected to drop towards $1,800 after escaping from the symmetrical triangle and after closing below the $1,900 psychological level.
You should be careful as a rejection from around the $1,900 or a false breakout above the black downtrend line could send the rate down again. Also, a failure to reach these levels could announce strong bears.
I believe that only a valid breakout above the black downtrend line could really validate a larger upside movement.
- GOLD Trading Tips
Sell a new lower low, drop below $1,848 level with an immediate downside target at $1,800 level.
Buy a valid breakout above the black downtrend line, the major upside target remains at the $2,075 all-time high.


