


AUD/USD overview with current day forecast
As shown on the weekly chart scale, the direction of the price trend of the major currency, Australian dollar, set an upward wave since earlier last year. In a larger wave model, this area formed a correction, the potential of which is close to exhaustion.
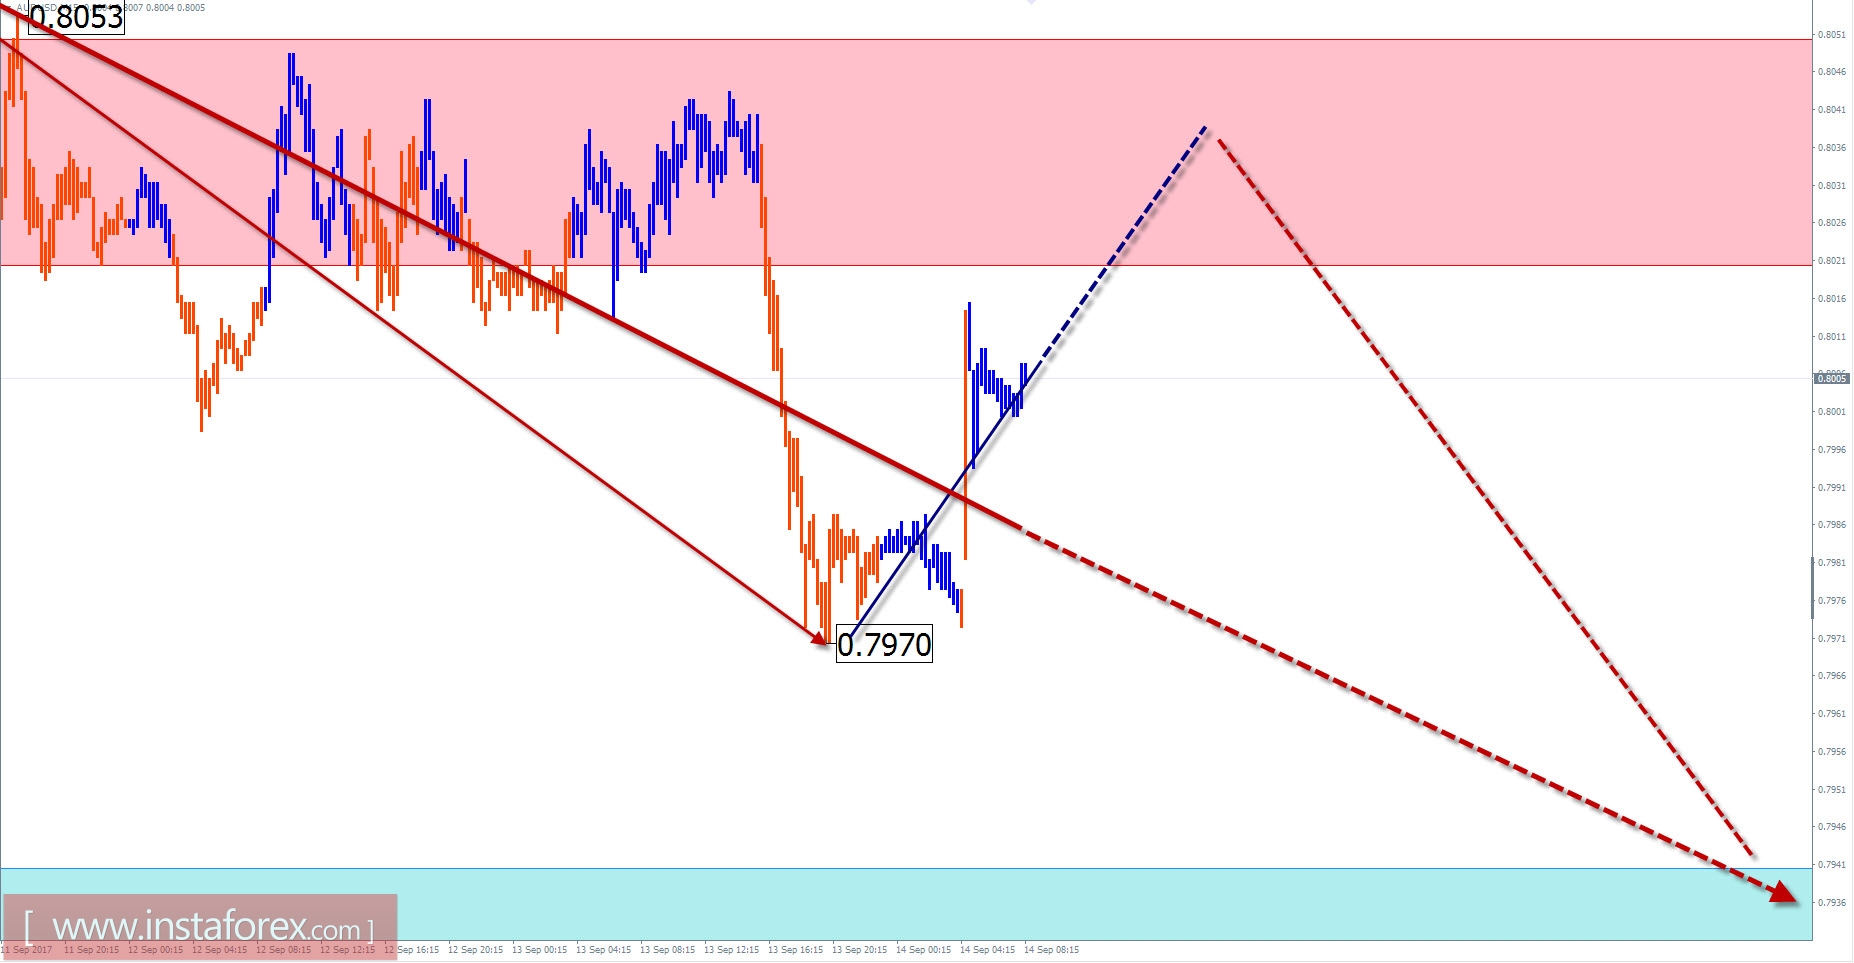
By the end of July, the price had reached the lower limit of the calculation area of the potential reversal. At the same time, the formation of a counter-construction began, which can become the basis for a new short-term trend. Since September 8, the final section is unfinished yet but has started.
In the first half of the current day, the completion of the upcoming pullback is expected. Within the boundaries of the resistance zone, it is expected that the rate will change, as the price begins to move down. Near the end of the day, the volatility of the pair may rise.
Boundaries of resistance zones:
- 0.8020 / 50
Boundaries of support zones:
- 0.7940 / 10
GBP/JPY outlook for the current day
As shown in the framework of the cross pair GBP / JPY, the upward trend continued for more than a year, as price extremes was formed by a distinct geometric figure such as the "ascending triangle" or "pennant".
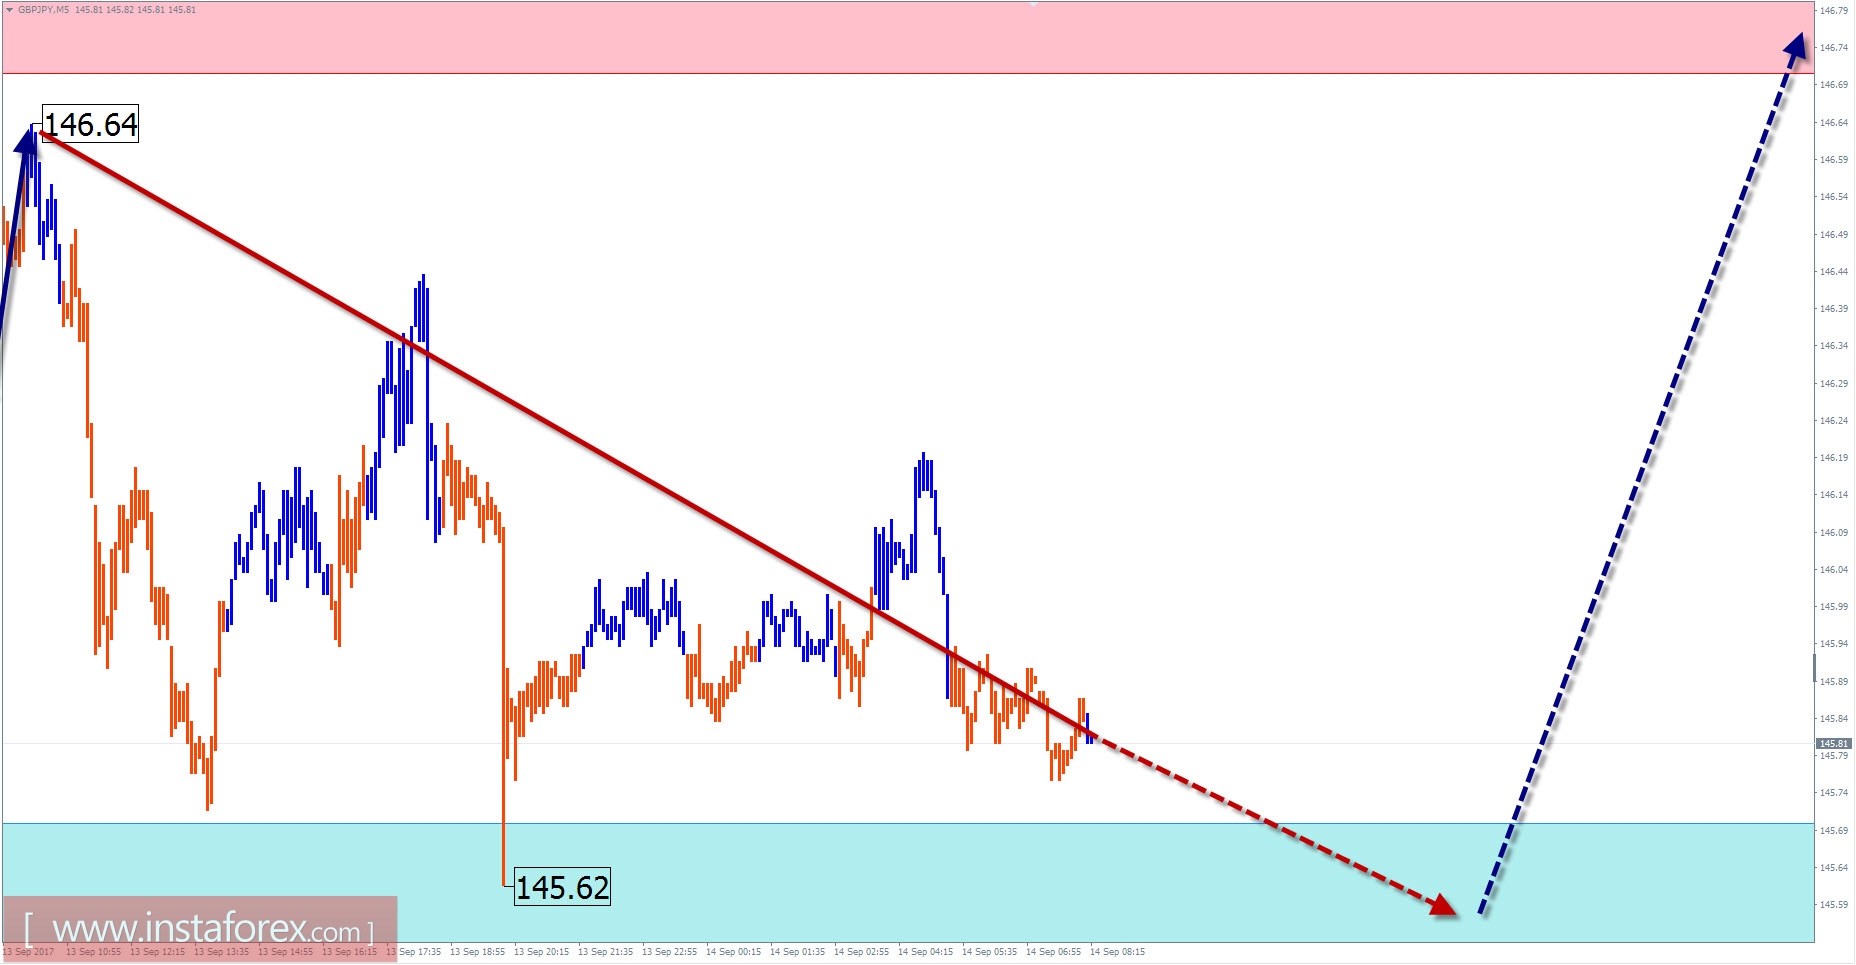
The last upward wave started on August 24. For three weeks, the pair's rate rose by 7 price figures, approaching the upper boundary of the formed channel. In recent days, there has been a bearish pullback, anticipating the final price surge upward.
Today, there is a high probability for the completion of the mood. Within the support zone, a reversal is expected and preparations for a price hike are expected.
The lower boundary of the estimated area at the end of the entire current wave is the resistance zone.
Boundaries of resistance zones:
- 146.70 / 147.00
Boundaries of support zones:
- 145.70 / 40
Explanations to the figures: For simplified wave analysis, a simple waveform is used that combines 3 parts (A; B; C).
The areas marked in the graphs are indicated by the calculation areas in which the probability of change in the direction significantly increased. Arrows indicate the wave counting according to the technique used by the author. The solid background of the arrows indicates the formed structure, the dotted one indicates the expected wave motion.
Attention: The wave algorithm does not take into account the duration of tool movements in time. The forecast is not a trading signal! To conduct a trade transaction you need confirmation signals used by your trading systems.


