


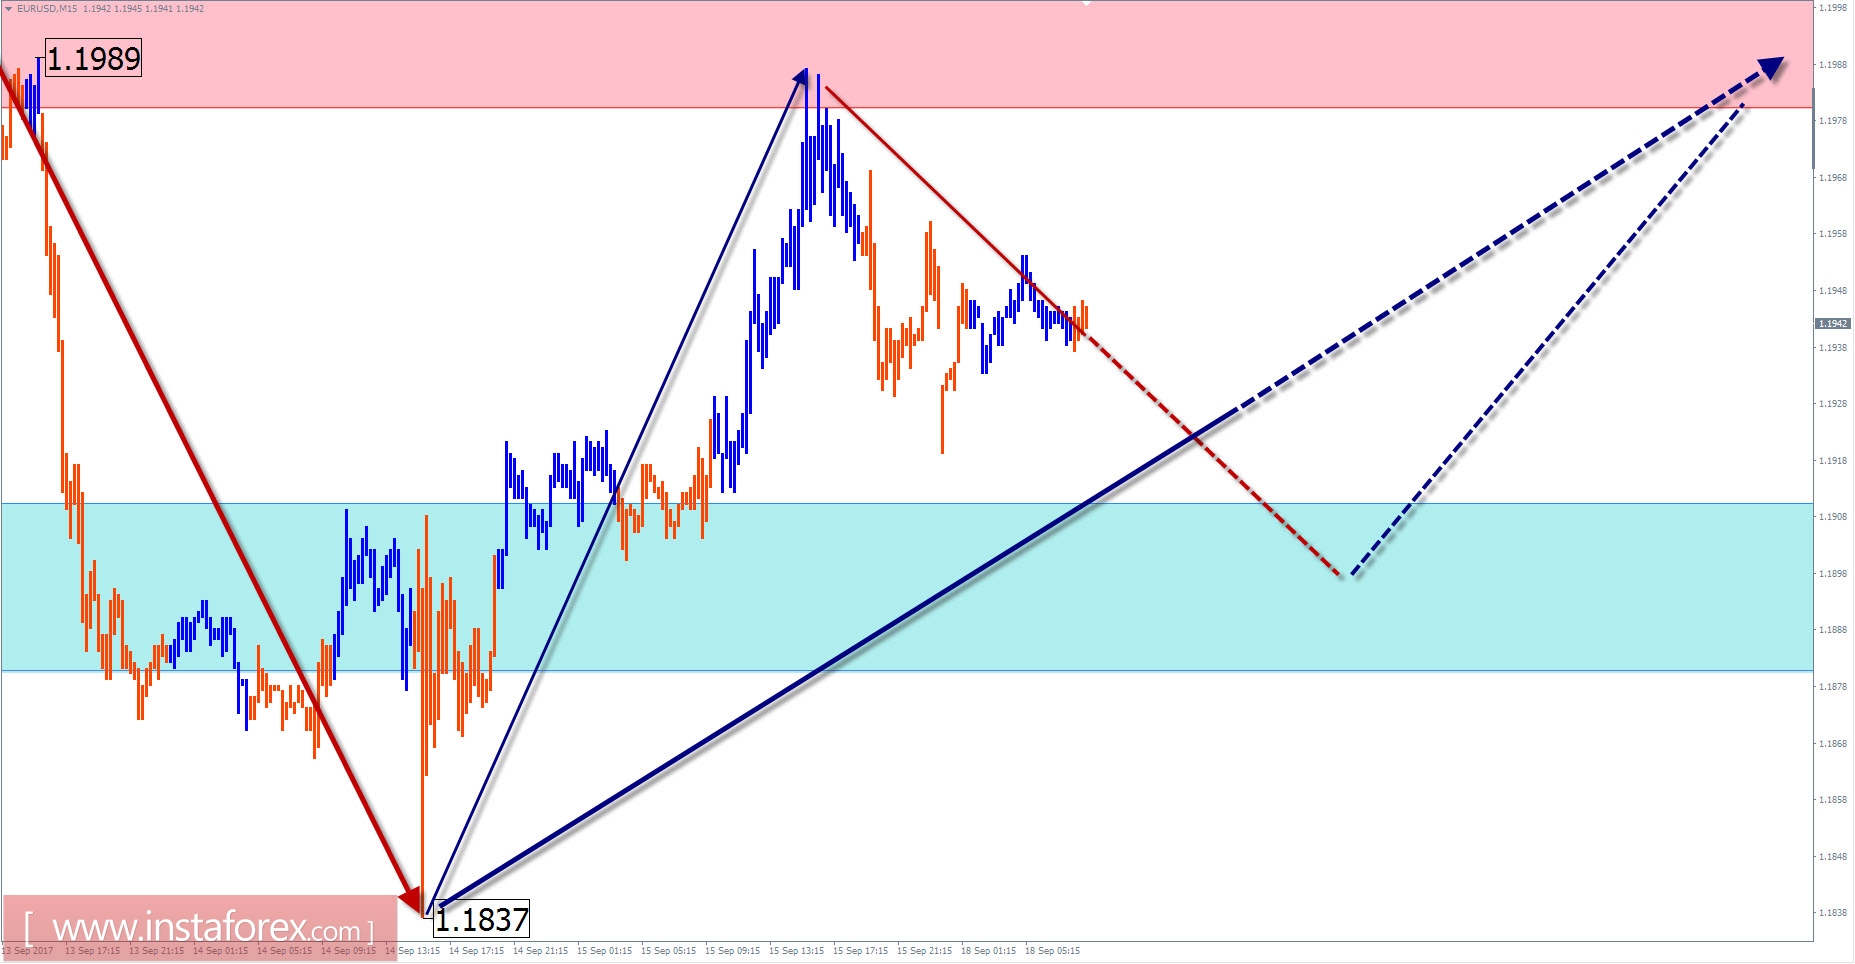
EUR / USD outlook for the current day
Since the beginning of the year, the upward wave conditions formed to resume the trend which dominated the chart of the instrument. The price of the pair has been in the zone of a potential reversal in a large scale last month. The incompleteness of the structure of the main wave indicates the need to continue the upward movement. A breakout in the upper boundary of the zone, there will be a correction which would increase the level of the wave.
Beginning on August 29, there was an opposing movement where a corrective segment was formed. The wave reached the minimum levels sufficient to complete it by the end of last week. The ascending section on September 14 is positioned in the first part of the reversal in a zigzag pattern.
In the short-term trading session, the probability of a flat tone is high with a common descending vector. A change in the nature of the movement and the growth of quotations are expected within the boundaries of the support area in the afternoon.
Boundaries of resistance zones:
-1.1980 / 1.2010
Boundaries of support zones:
-1.1910 / 1.1880
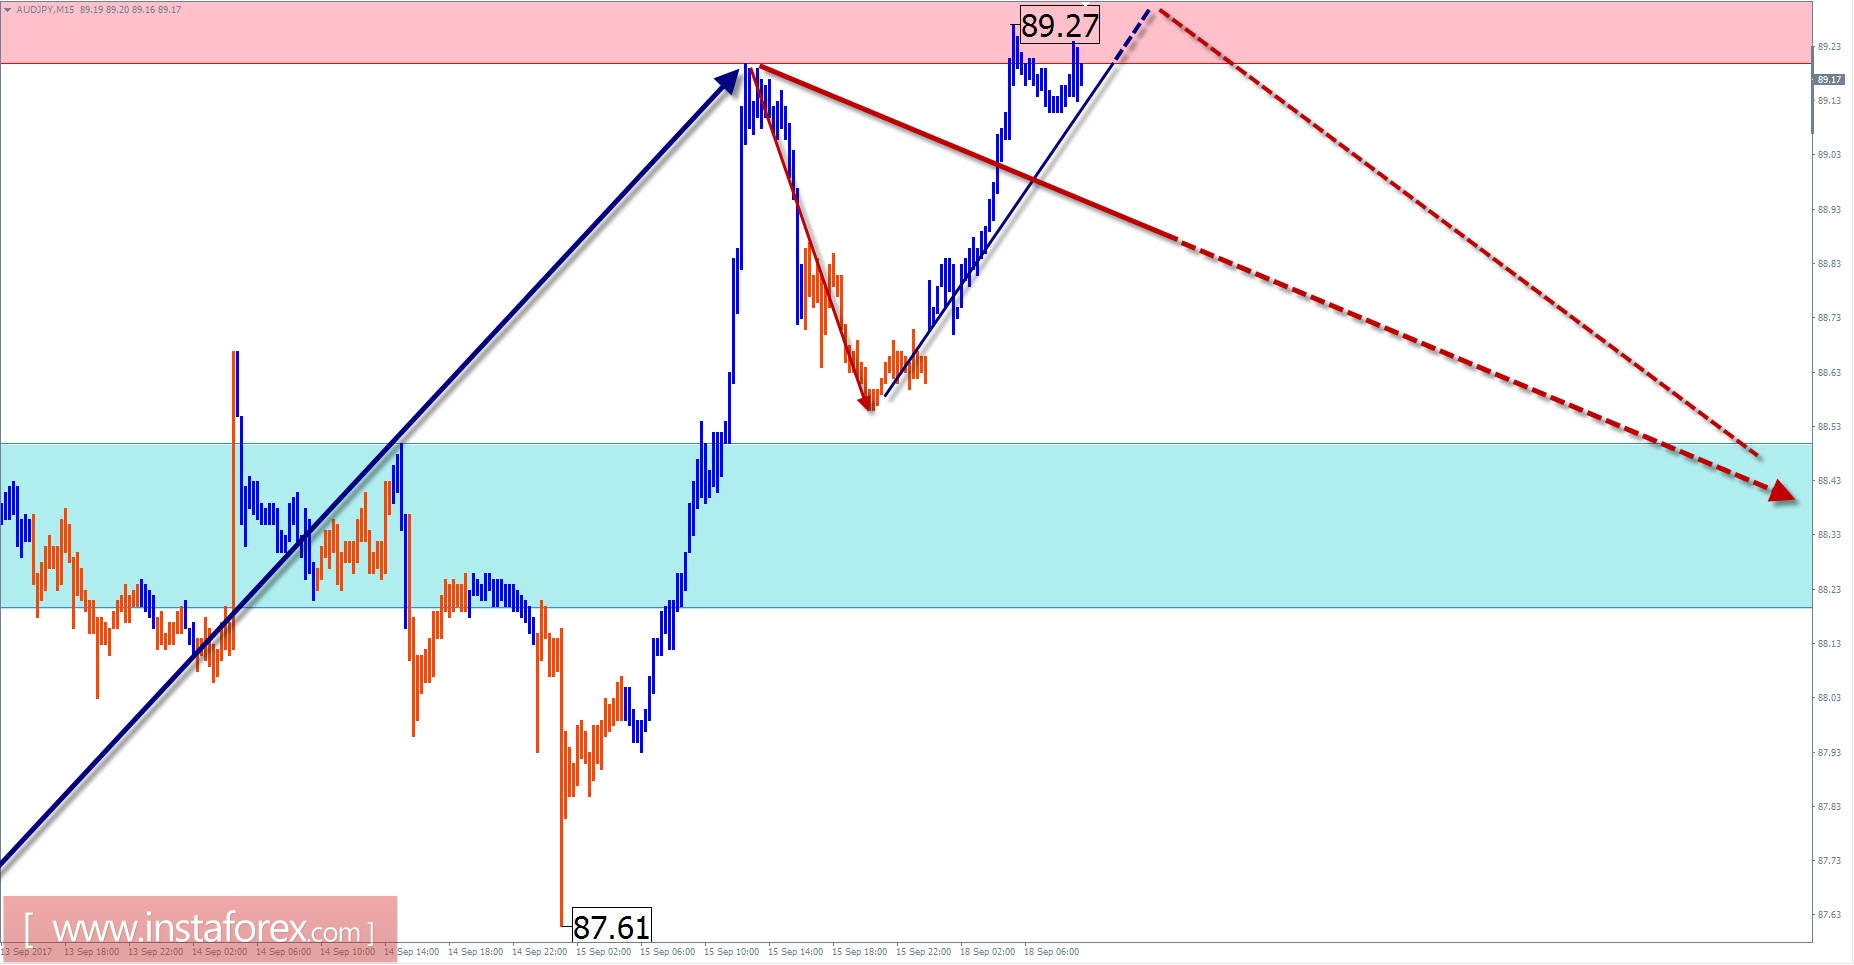
Overview of AUD / JPY with the forecast for the current day
Since July of last year, an upward wave is forming on the chart of the AUD/JPY cross currency pair. A correction was structured in a larger-scale wave model.
The price entered the pre-completion zone within the limits of the resistance level where a large time frame has passed. The probability of a change in the rate and the beginning of the formation of a downward wave in the near future is very high.
In the first half of the day, traders should expect flat price fluctuations while the pressure on the resistance zone is not ruled out. A breakout in the upper boundary of the zone is unlikely. Moreover, the formation of a reversal and the beginning of a decline are expected.
Boundaries of resistance zones:
- 89.20 / 50
Boundaries of support zones:
- 88.50 / 20
Explanations to the figures: For simplified wave analysis, a simple waveform is used that combines 3 parts namely A, B, and C. All types of correction are created and most of the impulses can be found in these waves. Every time frame is considered and the last incomplete wave is analyzed.
The areas marked on the graphs indicate the probability of a change in the direction of motion has significantly increased as calculated in the areas. Arrows indicate the wave counting following the technique used by the author. A solid background of the arrows signifying the structure has been formed while the dotted one means the expected wave motion.
Attention: The wave algorithm does not take into account the duration of the movement of tools in time. The forecast is not a trading signal! To conduct a bargain, you need to confirm the signals used by your trading systems.


