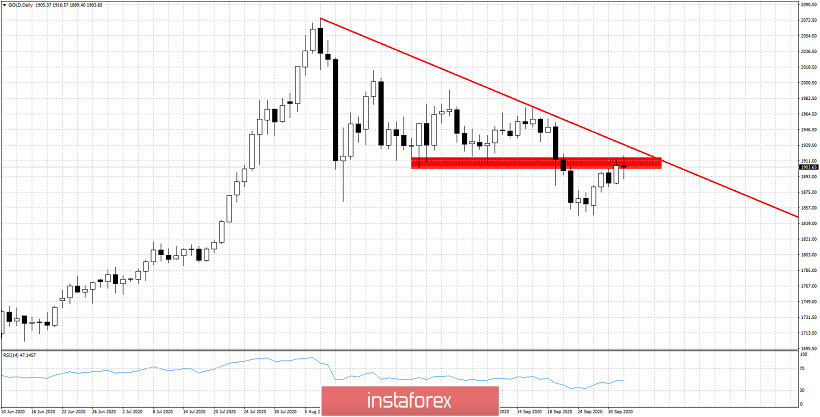
Gold bulls are fighting at the key resistance area of $1,900-$1,910. As we said many times before, this is very important resistance area. This area was tested as support four times before being broken. It will not be easy for bulls to recapture it.

Red rectangle - resistance
Red line - resistance trend line
Gold price is back testing the break down area. As long as price is below the red downward sloping trend line we prefer to be bearish and consider each bounce as a s selling opportunity. Price is near key resistance and that is why we prefer to short Gold now as stops are very close. The most likely scenario for us is to see Gold price reverse and move lower towards $1,800. Key short-term support levels are at $1,870 and $1,850.


