


AUD / USD overview with current day forecast
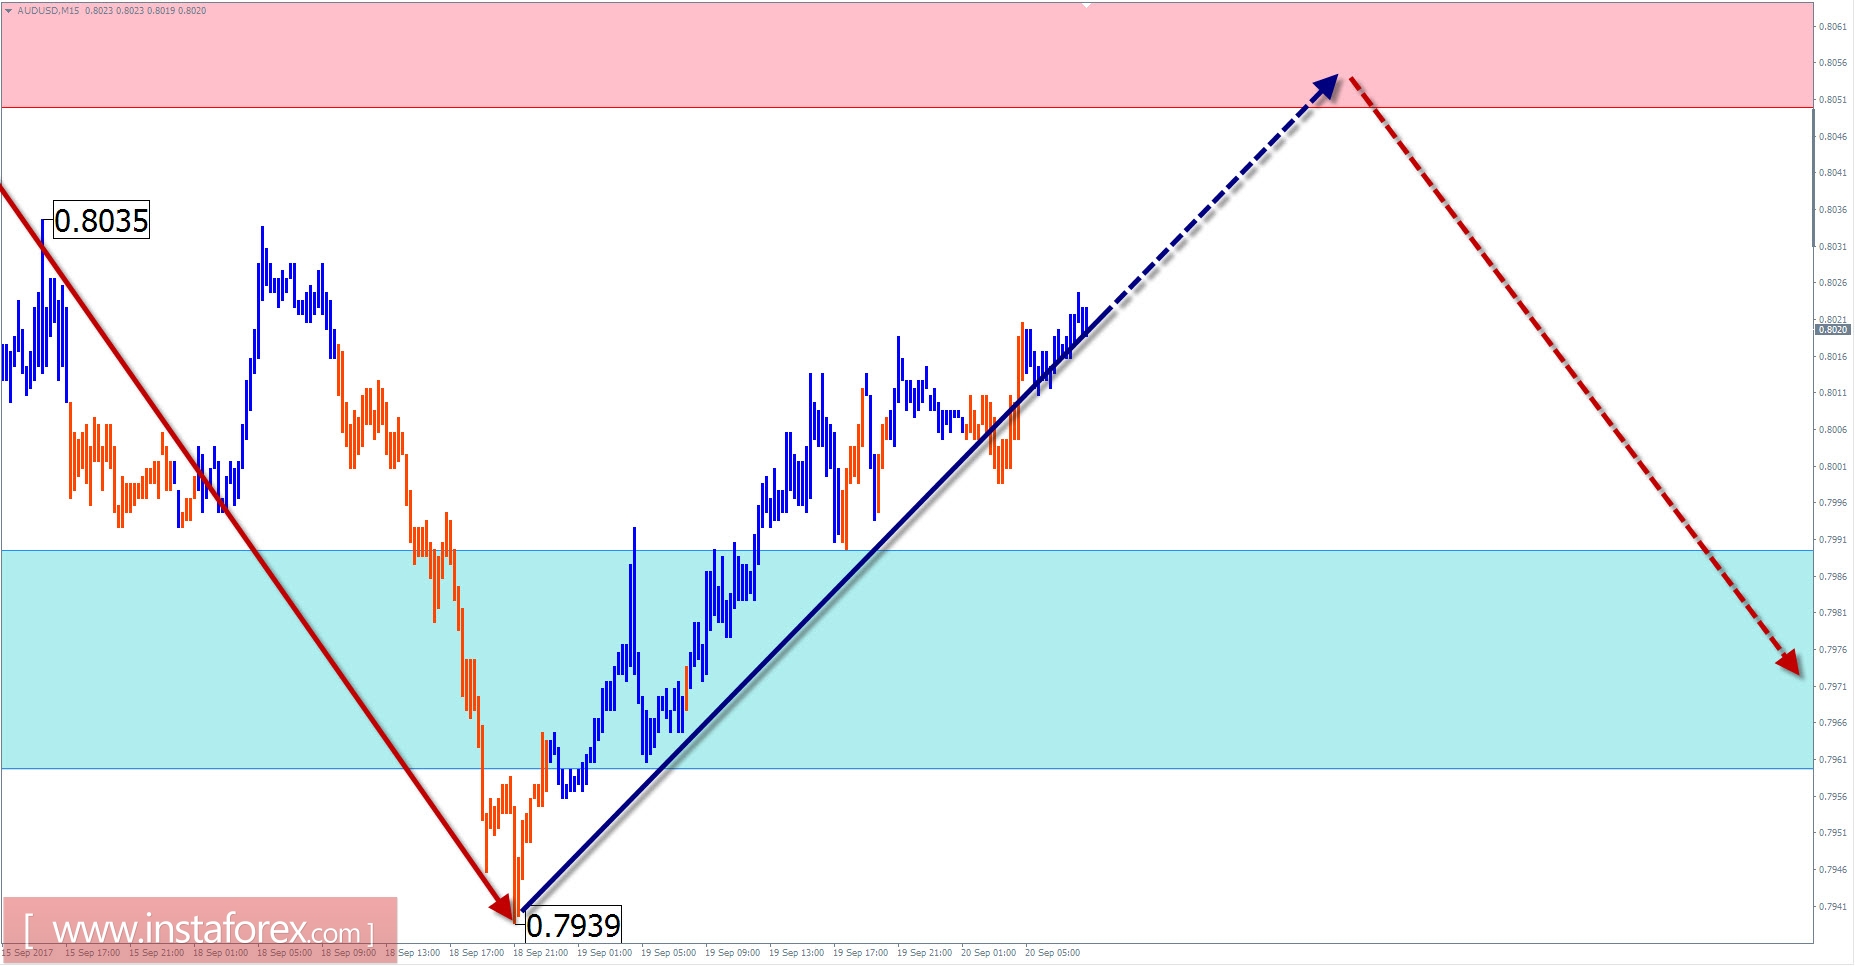
The graph of the Australian dollar has been moving upwards steadily in the recent months. The wave analysis shows the formation of a correction in the global downtrend. Analysis of the structure of the rising wave indicates its incompleteness. Quotations of the pair reached the lower limit of the potential reversal zone, which could trigger a counter price pullback.
Reducing the scale allows you to determine the last incomplete trend. The bearish wave of July 27 has a wrong appearance. In its structure, there is not enough final move (C). The first part formed where the September 8 positioned followed by the expected formation of the middle part.
In the short-term trading session, the trend in the past days of the upward movement is expected to be completed. Reversal is likely to happen within the resistance zone. A short-term breakout of the upper boundary of the zone is not ruled out. The downward trend will more likely begin at the end of the day.
Boundaries of resistance zones:
- 0.8050 / 80
Boundaries of support zones:
- 0.7990 / 60
EUR / JPY outlook with current day forecast
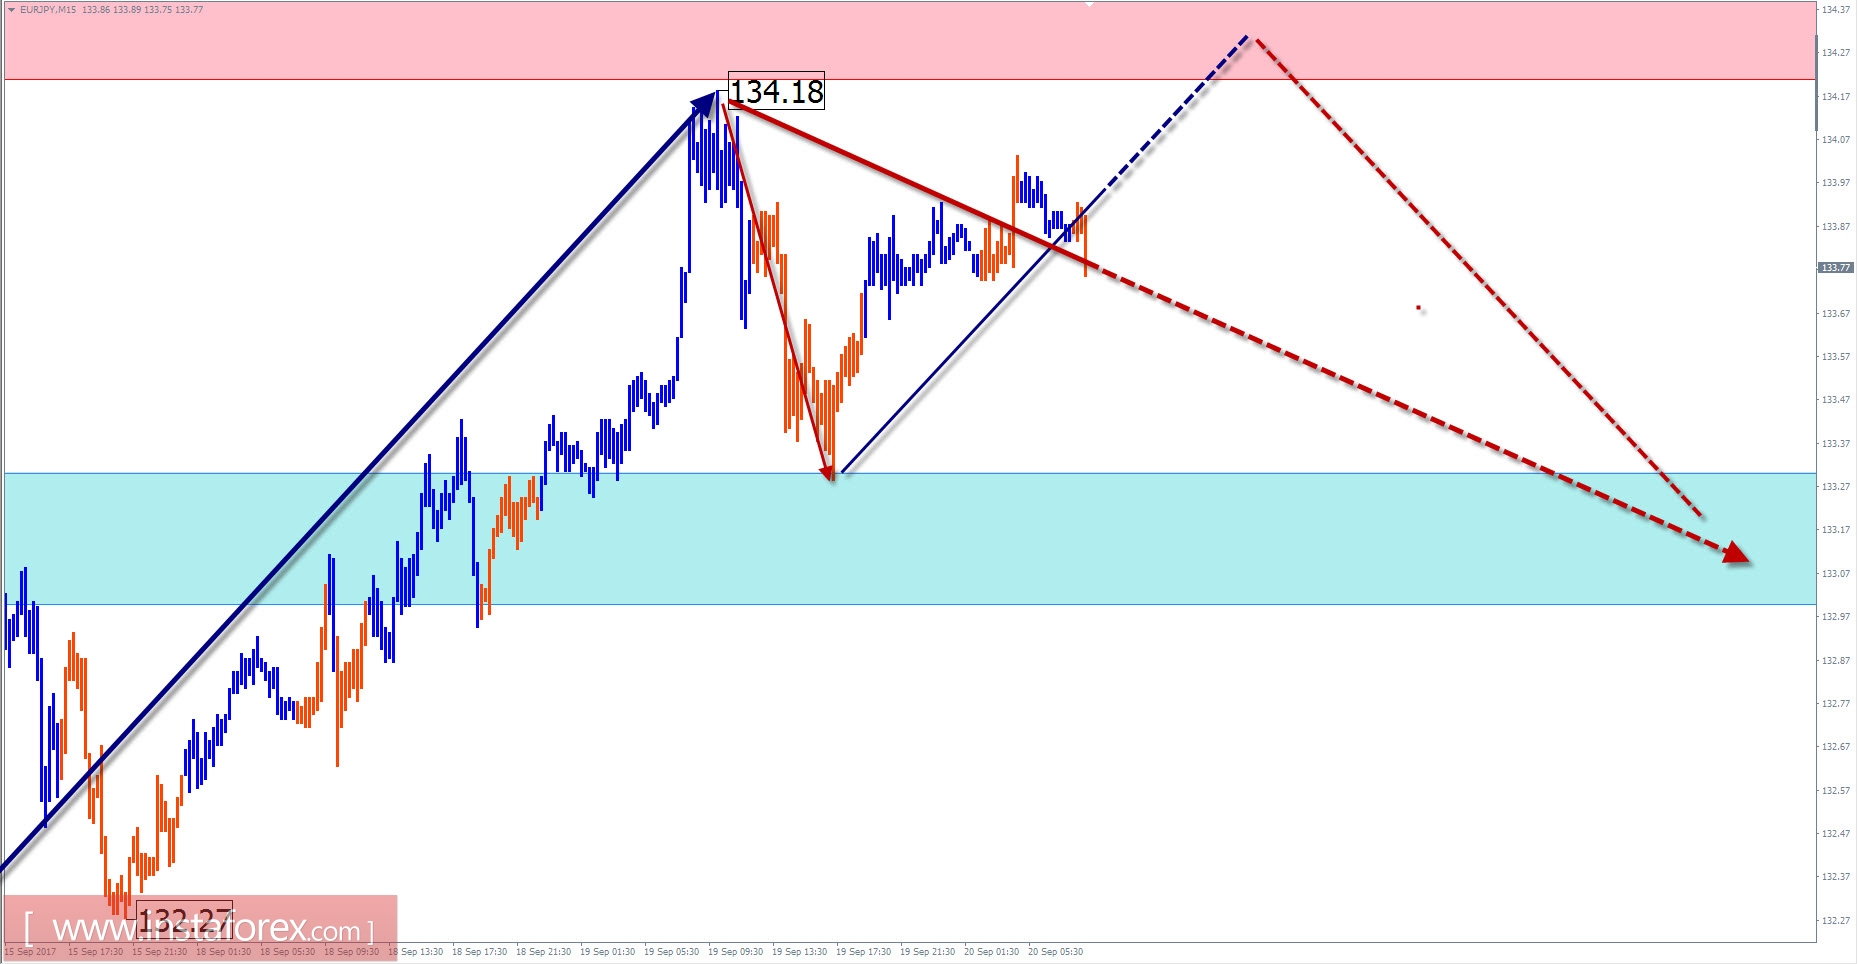
Since July of last year, the course of fluctuations in the cross rate of EUR/JPY is set by the algorithm of the rising wave. The price pushes up the final part of the wave (C) from April 17. The preliminary calculation of the target zone opens the possibility of assuming the continuation of the current price rise for at least 3 price figures.
The local high reached the lower boundary of the intermediate zone yesterday. There is a strong level of resistance on a large scale in the graph. Given the formation of the beginning of a hidden counter wave last week, there is a high probability of a short-term decline in the coming days.
For today's trading session, there will most likely be a slightly upward trend. A turn is expected within the boundaries of the resistance zone. The active phase of decline is anticipated by the end of the day or tomorrow.
Boundaries of resistance zones:
- 134.20 / 50
Boundaries of support zones:
- 133.30 / 132.80
Explanations to the figures: For simplified wave analysis, a simple waveform is used that combines 3 parts namely A, B, and C. All types of correction are created and most of the impulses can be found in these waves. Every time frame is considered and the last incomplete wave is analyzed.
The areas marked on the graphs indicate the probability of a change in the direction of motion has significantly increased as calculated in the areas. Arrows indicate the wave counting following the technique used by the author. A solid background of the arrows signifies the structure has been formed while the dotted one means the expected wave motion.
Attention: The wave algorithm does not take into account the duration of the movement of tools in time. The forecast is not a trading signal! To conduct a bargain, you need to confirm the signals used by your trading systems.


