Gold price is trading around key resistance area of $1,900-$1,910. In Ichimoku cloud terms, short-term trend is neutral as price is inside the Kumo (cloud). The cloud boundaries are now used as key support and resistance levels.
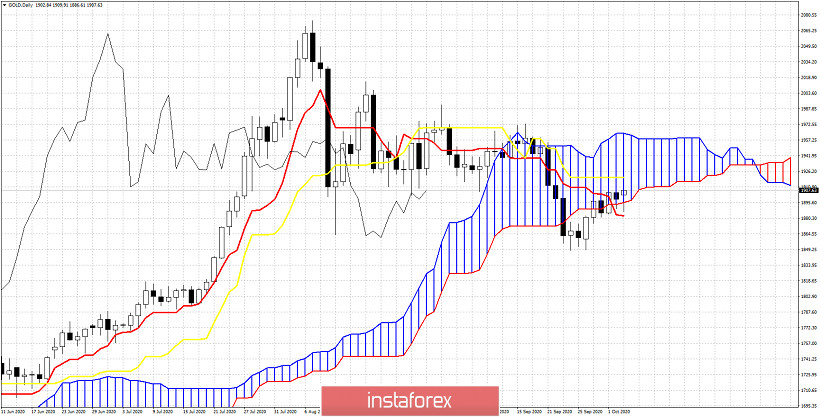
The lower cloud boundary and key support is at $1,895. Holding above this level will give bulls hopes for a move towards the upper cloud boundary at $1,958. Price is between the kijun-sen (yellow line indicator) and the tenkan-sen (red line indicator). The tenkan-sen provides support at $1,882 and the kijun-sen provides resistance at $1,920. As long as price closes above $1,895 we remain short-term optimistic for a move towards $1,950, specially if resistance at $1,920 is broken. A rejection at cloud and a move below $1,895 will increase chances for a move towards $1,850.
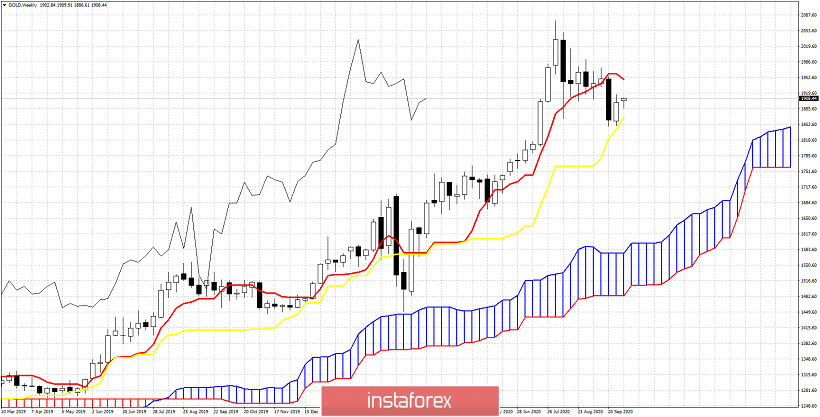
On a weekly basis Gold price has found support at the kijun-sen but price is below the tenkan-sen. Bulls need to recapture $1,959 in order to hope for new higher highs.


