


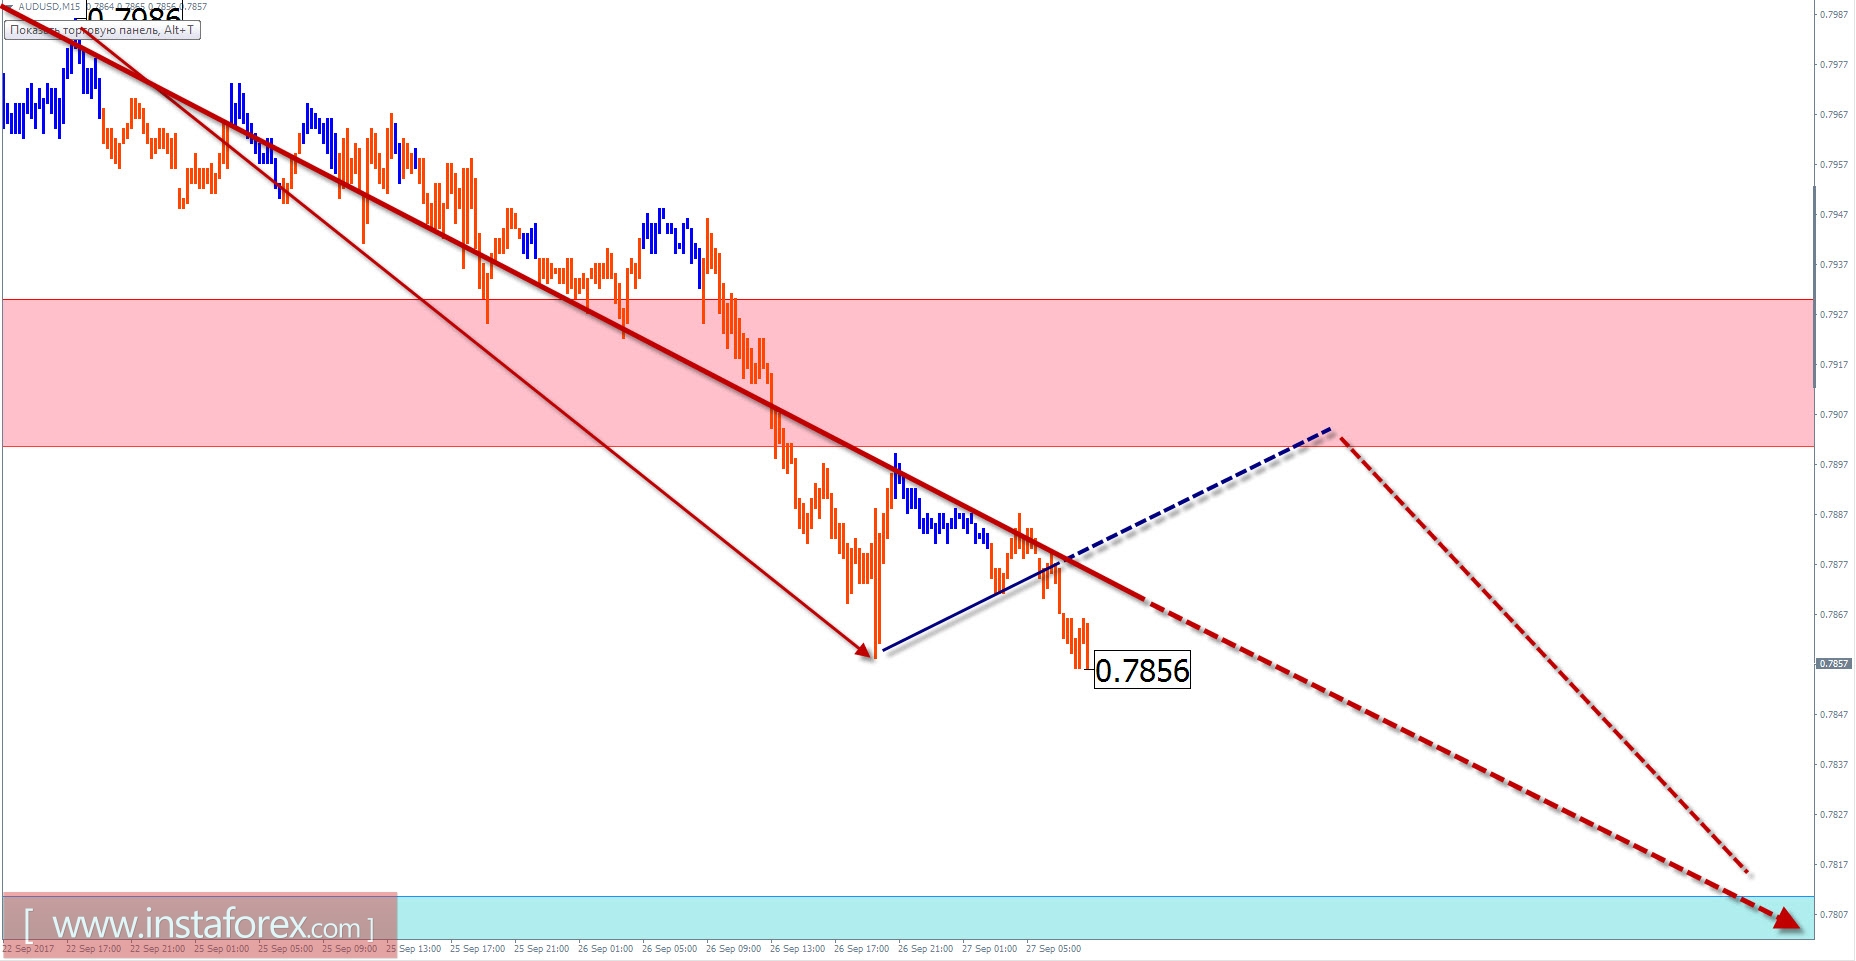
Overview of AUD / USD with the current day forecast.
The result of the upward wave formation, which started in January of last year, was the price contact with the lower boundary of the critical reversal zone. The wave analysis of the last months' chart shows the formation of the downward plane from the end of July. From September 20, the price movement rate is set by the final part of the wave (C). The preliminary target traffic zone is within the price figure from the current pair rate.
Today, in the morning, you can count on a small upward rollback. Price growth above the boundaries of resistance is unlikely. Toward the end of the day, the direction of the movement should return to the descending course. The support zone indicates the upper boundary of the expected zone of completion of the entire wave.
The boundaries of the resistance zones:
- 0.7900 / 0.7930
The boundaries of the support zones:
- 0.7810 / 0.7780
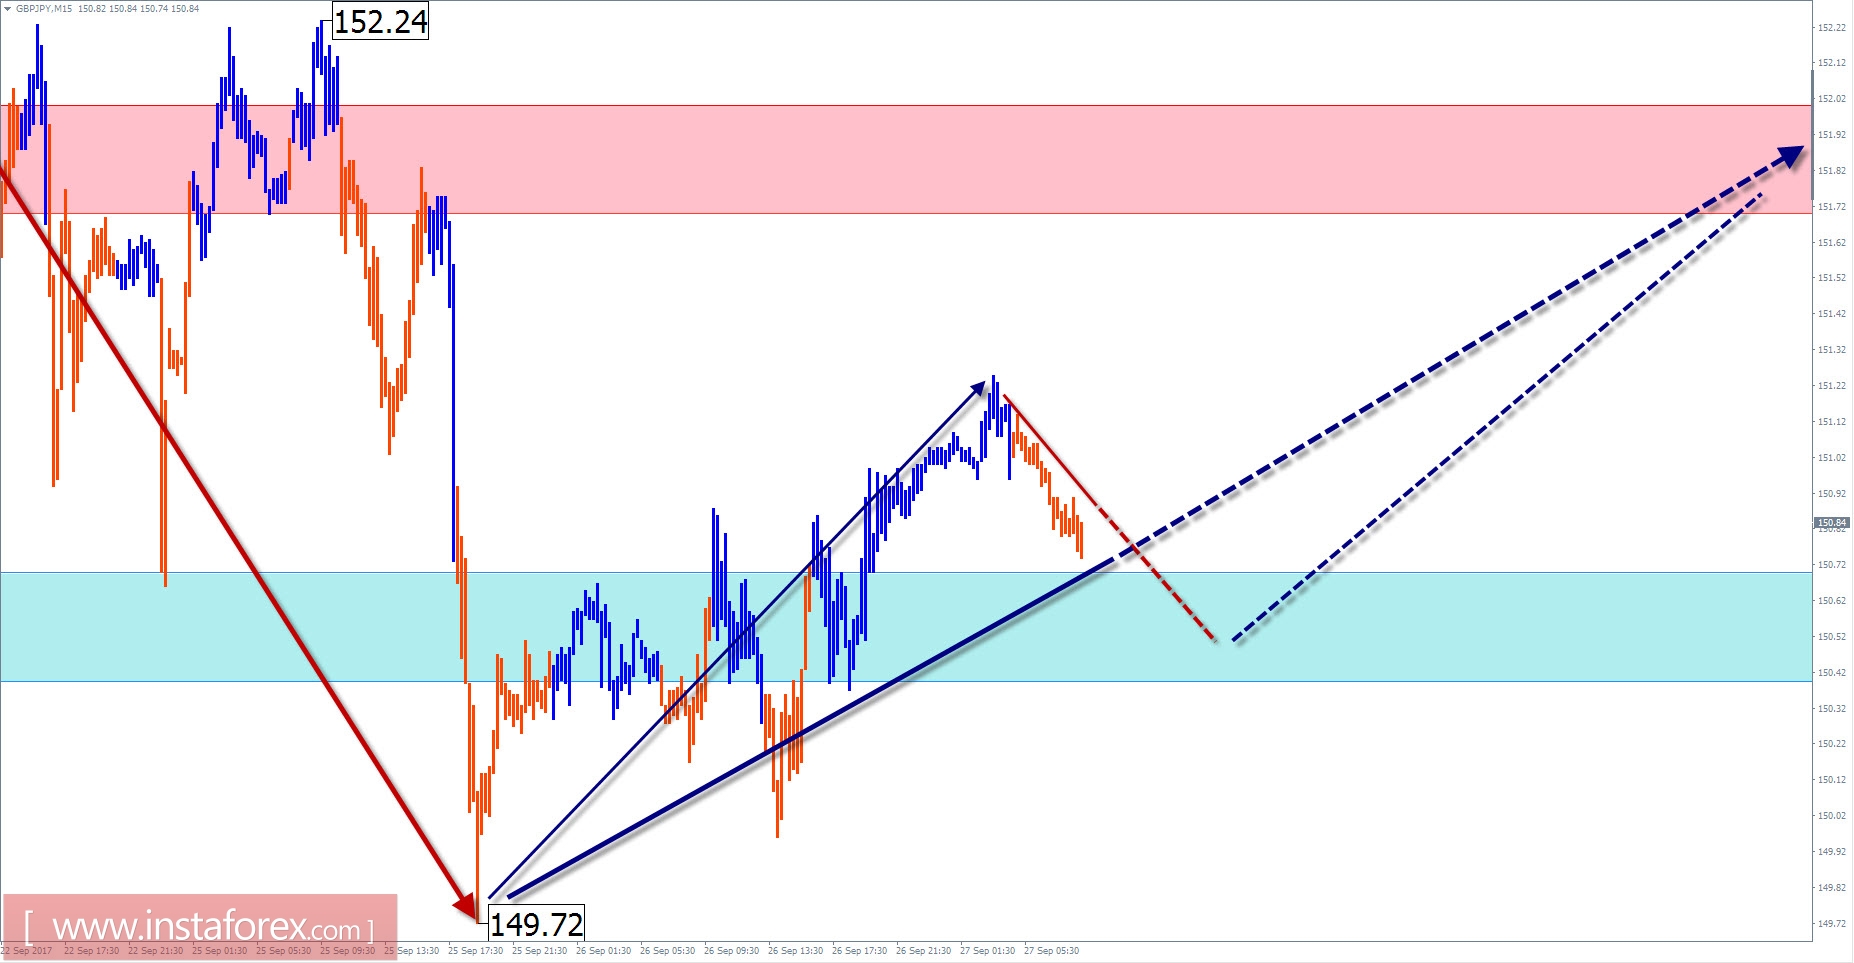
Overview of GBP / JPY with the forecast for the current day
In the upward wave of the cross, which sets the main direction of the trend in the last 2 years, the quotes reached the lower boundary of a wide zone of a potential reversal.
In recent weeks, a flat correction wave has formed in the lateral flute. Its potential is not sufficient to form a reversal. After it is completed, you can expect to try again pressure on the upper zone.
Today, the most likely scenario will be a common flat tone. The downward vector of fluctuations is more likely in the nearest trading session. The exchange rate and price rise within the formed corridor is expected at the end of the day. The breakthrough of the upper boundary of the resistance zone is not ruled out, but more real in the following days.
The boundaries of the zones of resistance:
- 151.70 / 152.00
The boundaries of the support zones:
- 150.70 / 40
Explanations to the figures: For simplified wave analysis, a simple waveform is used that combines 3 parts (A; B; C). Of these waves, all kinds of correction are composed and most of the impulses. On each considered time frame the last, incomplete wave is analyzed.
The areas marked on the graphs are indicated by the calculation areas in which the probability of a change in the direction of motion is significantly increased. Arrows indicate the wave counting according to the technique used by the author. The solid background of the arrows indicates the structure formed, the dotted one indicates the expected wave motion.
Attention: The wave algorithm does not take into account the duration of the tool movements in time. The forecast is not a trading signal! To conduct a trade transaction, you need to confirm the signals of your trading systems.


