


EUR / USD
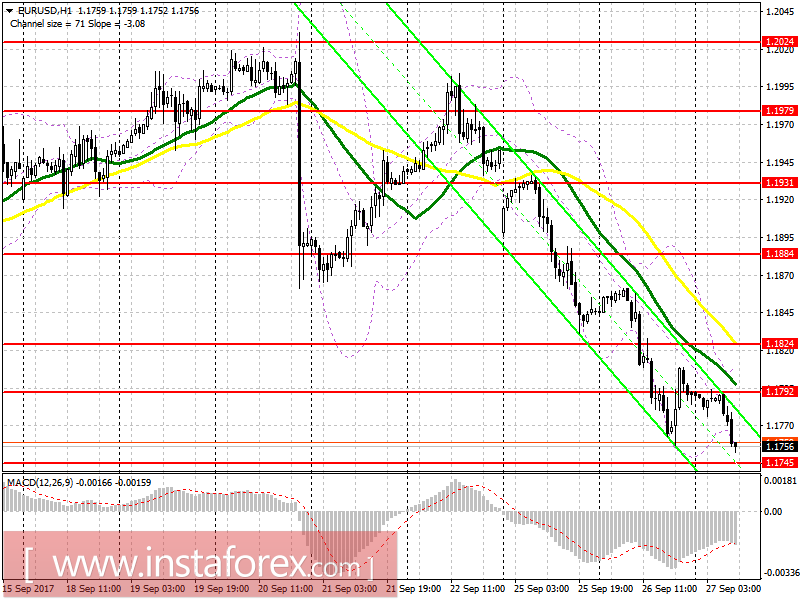
To open long positions for EURUSD, you need:
An important level of support is located in the range of 1.1745. The renewal of this level will also form a divergence on the MACD indicator, which will be a clear signal for buyers to increase long positions in the euro. In the case of a larger euro decline in the morning, returning to buying is best for a rebound from the support level of 1.1710.
To open short positions for EURUSD, you need:
You can sell the euro after you have worked out the divergence on the MACD indicator in the support area of 1.1745. You can again return to this level with its breakdown and consolidation below it. The main objectives of the sellers will be located in the area of 1.1710 and 1.1666. If the euro rises in the first half of the day, it is possible to consider new short positions only after renewing resistance at 1.1792 or by a rebound from 1.1824.
GBP / USD
To open long positions for GBP / USD, you need:
I do not recommend hurrying to buy the pound. Only the formation of a false breakout with a return to the level of 1.3382 will be the first signal to the opening of long positions. Otherwise, you can count on the growth of GBP / USD only after upgrading support at 1.3345 or on a rebound from a larger minimum of 1.3309.
To open short positions for GBP / USD, you need:
Sellers will try to gain a foothold below 1.3382, which will be an additional signal to increase short positions with further calculation for the update of support at 1.3345 and 1.3309 in the first half of the day. In case of pound growth, you can return to short positions after updating the support level of 1.3440.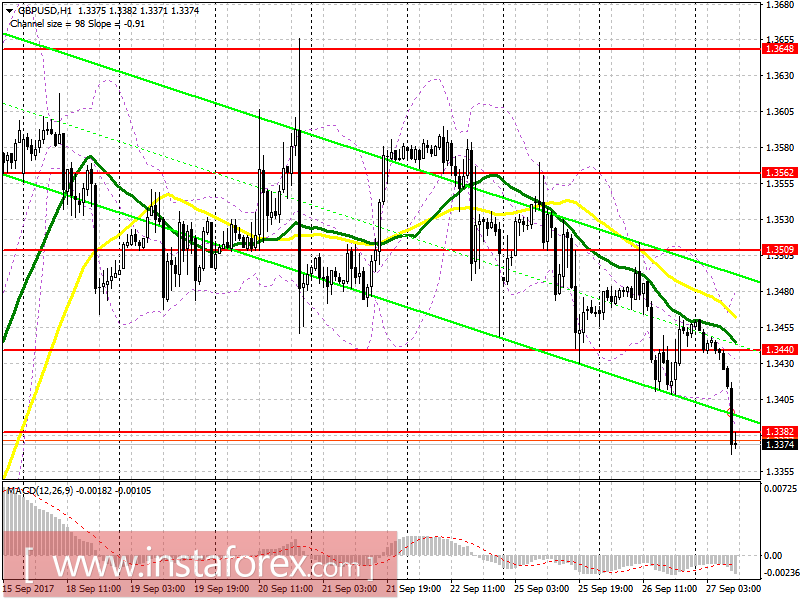
Indicator description
MA (moving average) 50 days - yellow
MA (moving average) 30 days - green
MACD: fast EMA 12, slow EMA 26, SMA 9
Bollinger Bands 20


