


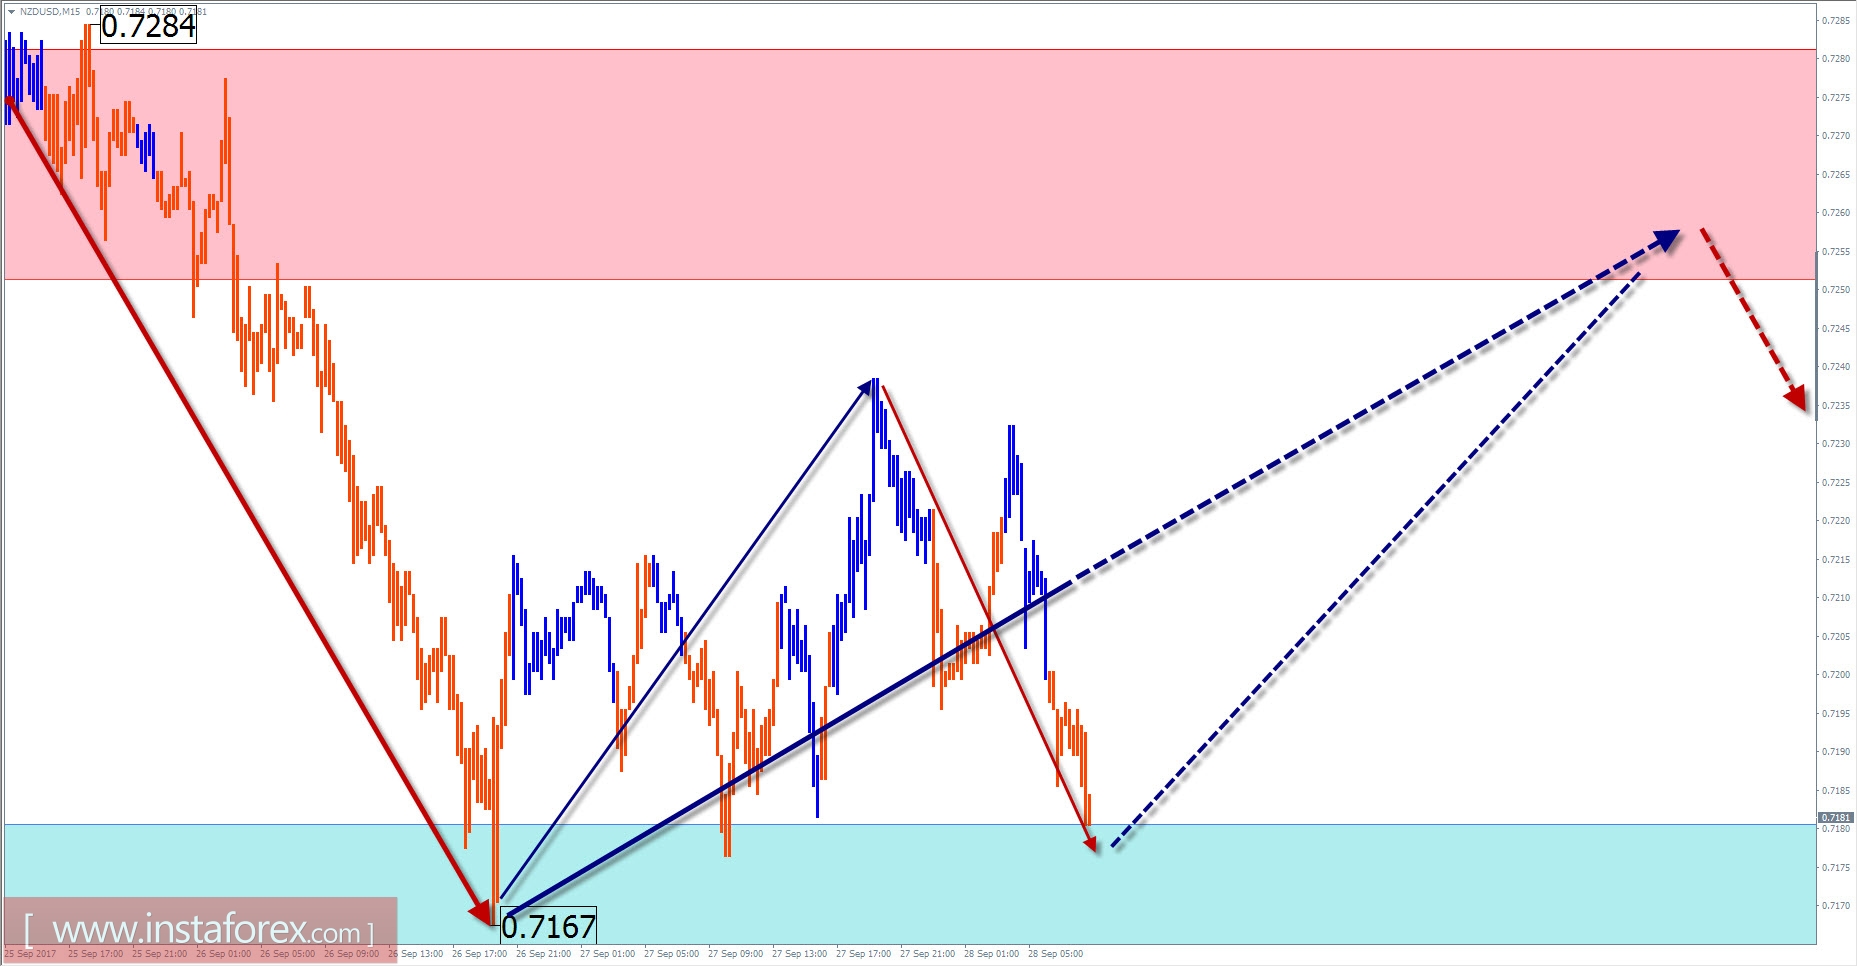
NZD / USD pair outlook for the current day
On the chart of the New Zealand dollar major pair, the last unfinished short-term wave was counted since July 27. The wave corrects the trend area in a larger wave model.
From September 20, the development of the final wave section (C) can be observed. The price reached the upper limit of the support zone shows the wave's minimum possible level of extension. The price of the pair moved sideways along the control level for two days, forming a pullback.
Today, there is a high probability of completing the ascending portion of the movement. Before the rise, a short-term reduction in the support zone is not ruled out. The resistance zone shows the upper limit of daily volatility.
Boundaries of resistance zones:
- 0.7250 / 80
Boundaries of support zones:
- 0.7180 / 50
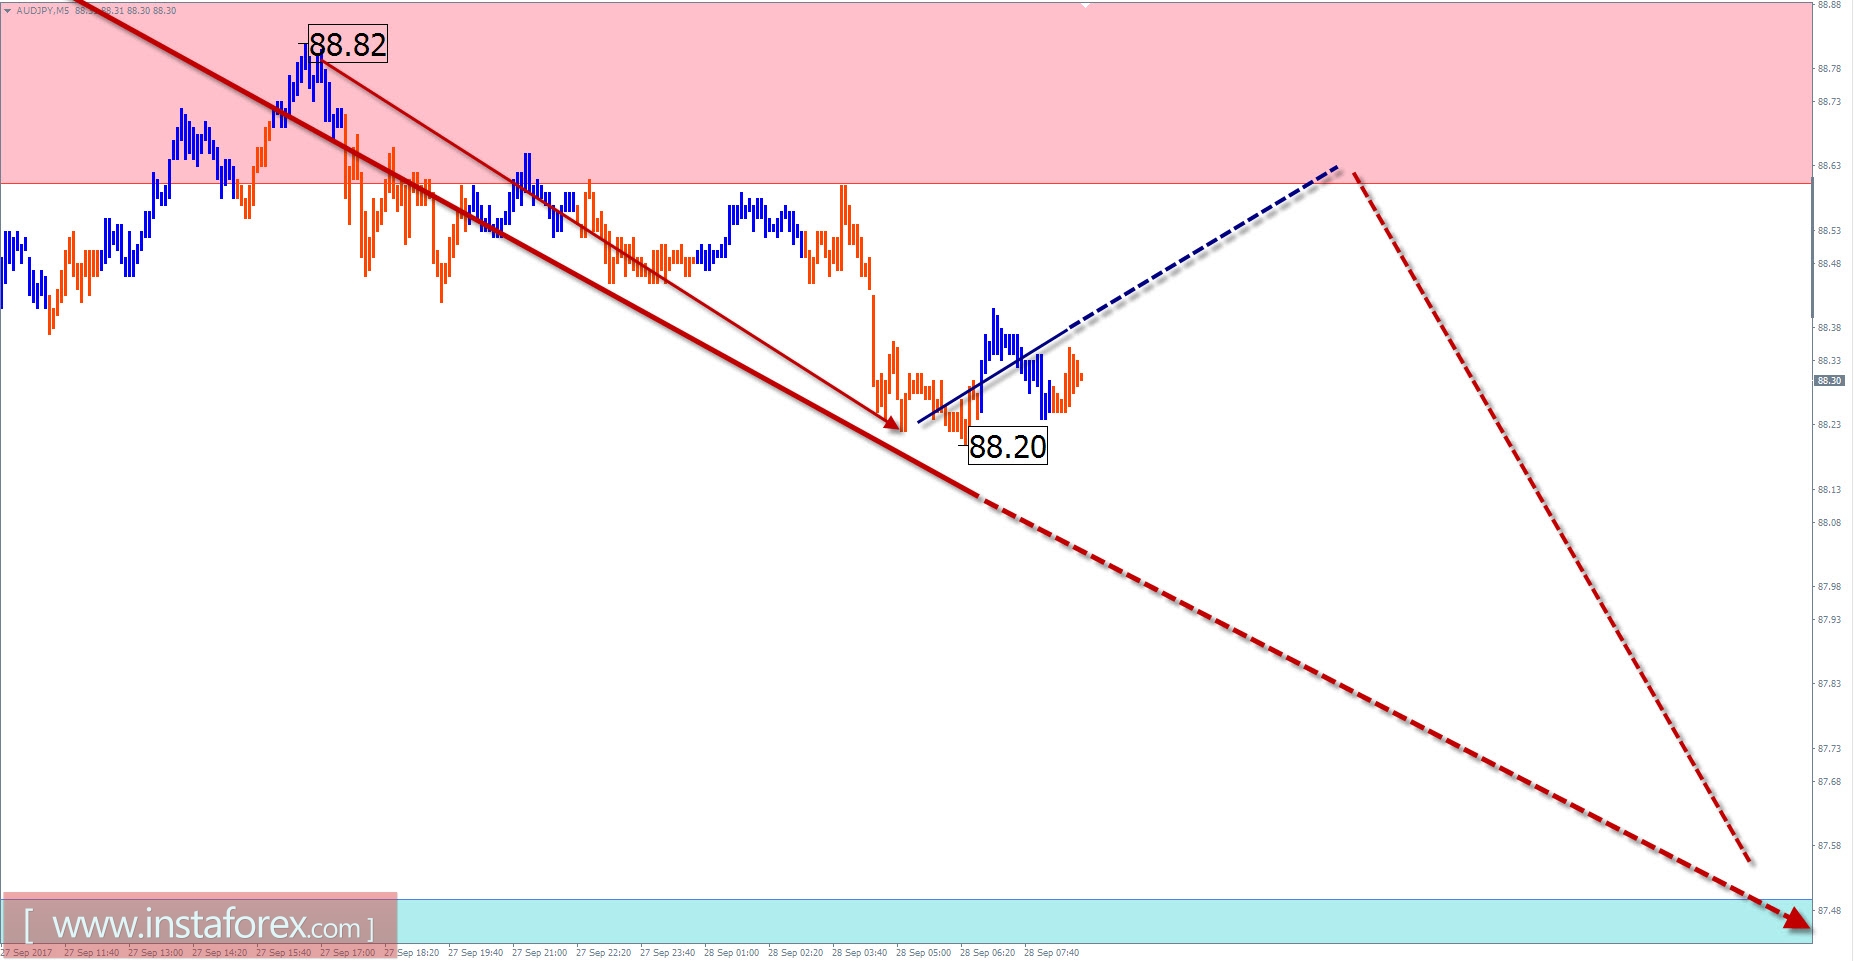
Overview of AUD / JPY pair with the forecast for the current day
Since June of last year, the AUD/JPY cross currency pair quotes are moving up. The highest price of the chart formed a geometric figure "ascending pennant" on the site. The end of the framework is within the potential reversal area. Nevertheless, there is no reversal pattern of a sufficient wave level on the chart, which indicates the continuation of the current trend.
On the 4-hour time frame, the last wave was launched on 11 August. In its structure for the current month, a corrective figure of complex shape is formed. The estimated level of completion is within the support zone.
Today, a short-term price hike is possible In the morning. Closer to the end of the day, a change in the course of the trend and the decline of the price is expected.
Boundaries of resistance zones:
- 88.60 / 90
Boundaries of support zones:
- 87.50 / 20
Explanations to the figures: For simplified wave analysis, a simple waveform is used that combines 3 parts namely A, B, and C. All types of correction are created and most of the impulses can be found in these waves. Every time frame is considered and the last incomplete wave is analyzed.
The areas marked on the graphs indicate the probability of a change in the direction of motion has significantly increased as calculated in the areas. Arrows indicate the wave counting following the technique used by the author. A solid background of the arrows signifies the structure has been formed while the dotted one means the expected wave motion.
Attention: The wave algorithm does not take into account the duration of the movement of tools in time. The forecast is not a trading signal! To conduct a bargain, you need to confirm the signals used by your trading systems.


