


USD / CHF pair review with current day forecast
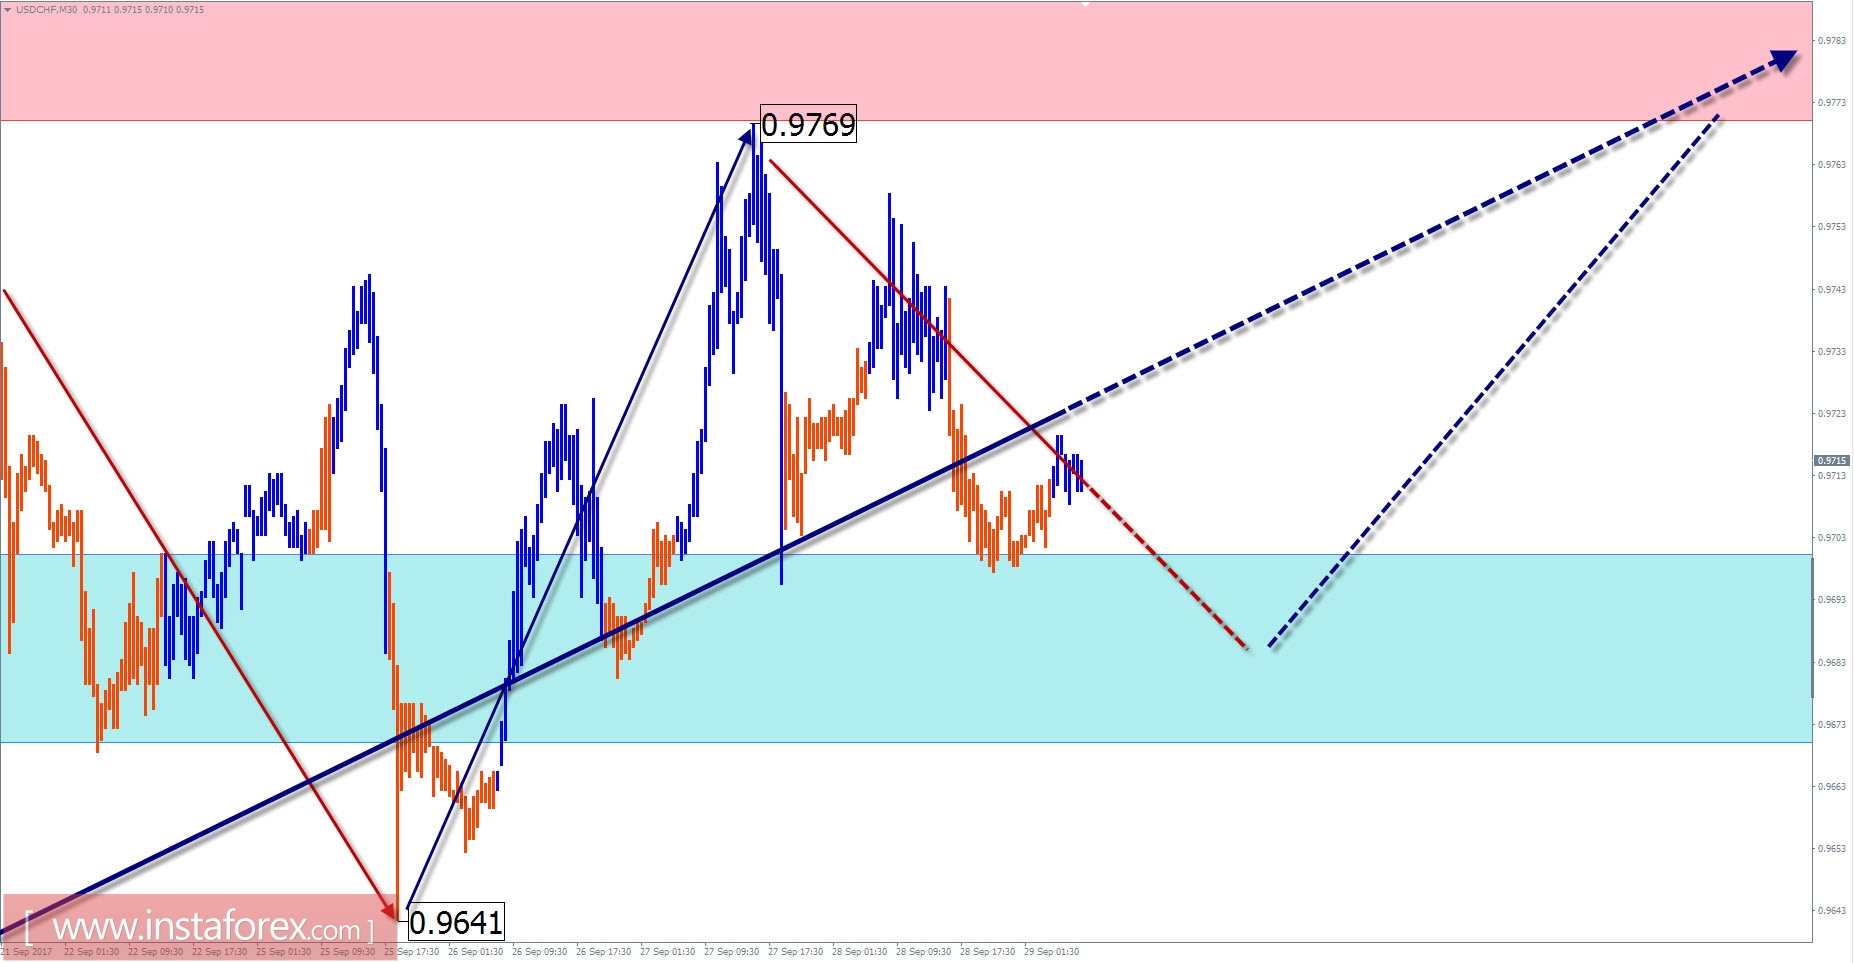
The incomplete wave structure of the Swiss franc major pair on a 4-hour time frame is the ascending zigzag pattern on August 29. The final part of the wave (C) was formed the last week. The price has reached the minimum calculated level of extension. The structure of the entire wave has not been completed, so we need to wait for the continuation of the recovery.
Since last week, a corrective rollback of a complex shape has been formed from the control level.
In the next session for today, there is a tendency for the price to drop. A short breakout of the lower support limit is not ruled out. A change in direction is expected towards the end of the day. The upper boundary of the daily volatility of the pair limits the resistance zone.
Boundaries of resistance zones:
- 0.9770 / 0.9800
Boundaries of support zones:
- 0.9700 / 0.9670
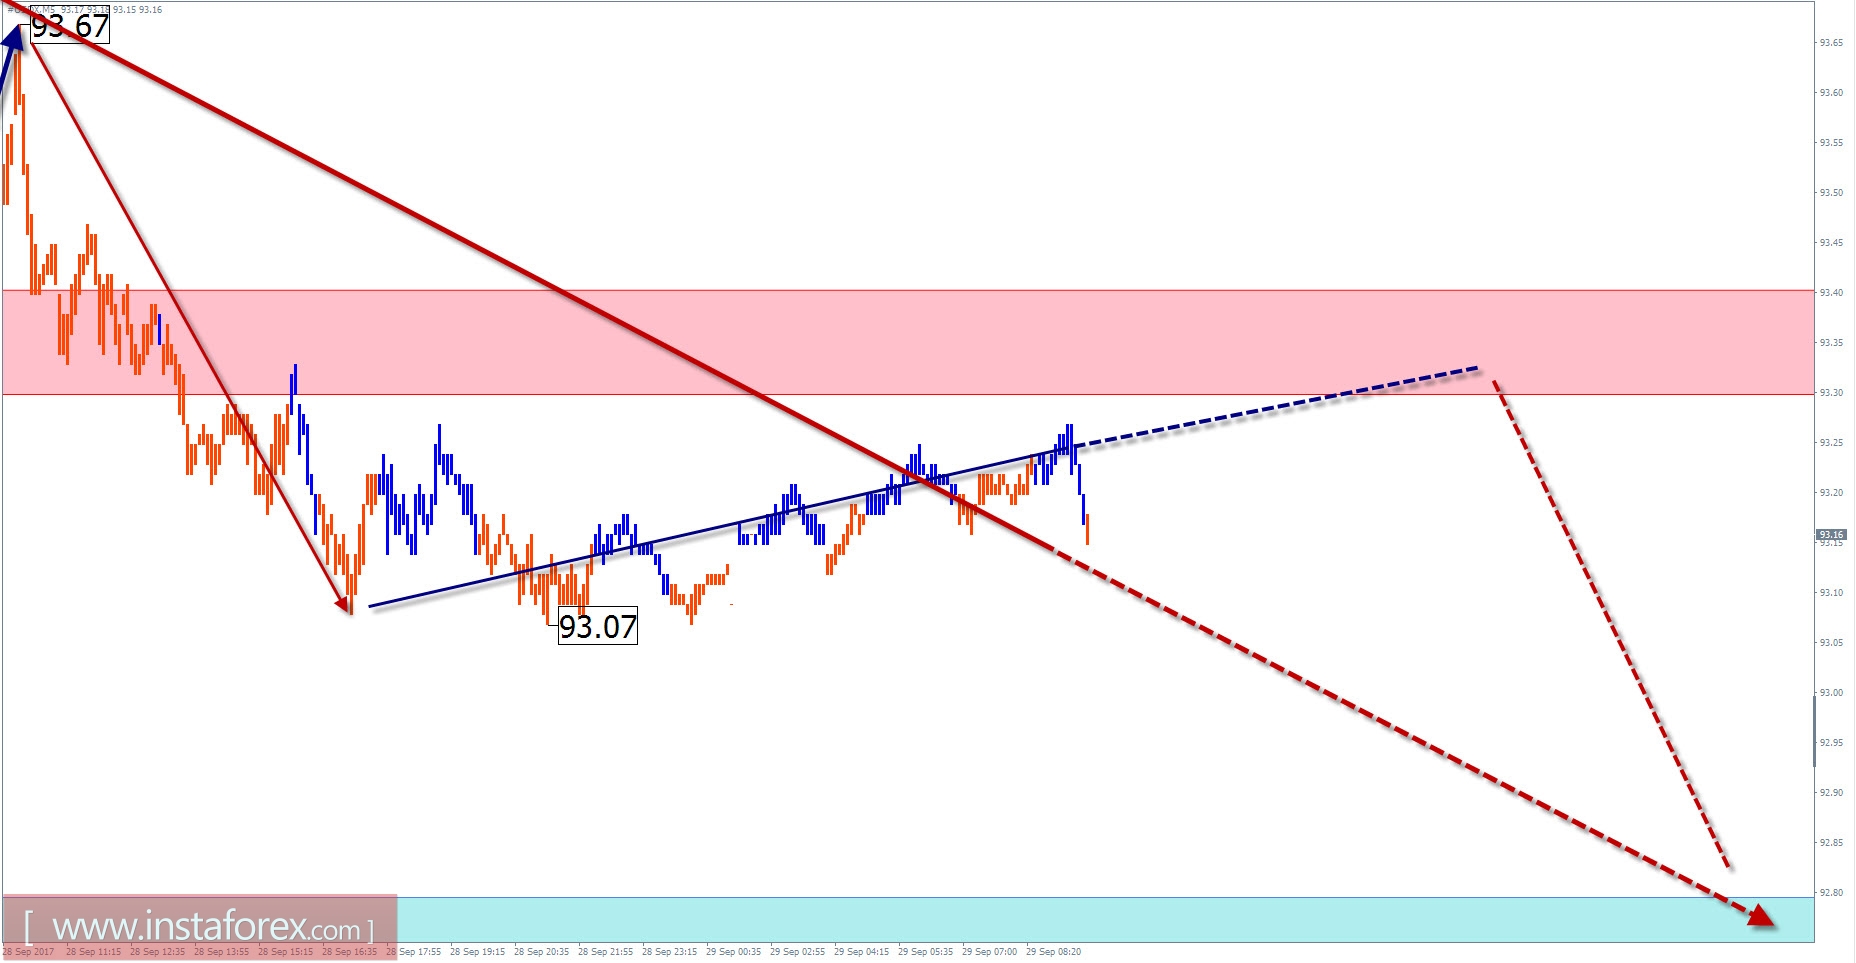
Overview of #USDX (US dollar index) with a forecast for the current day
On the graph, the trend in the short-term direction of the US dollar index is set by the corrective figure of "expanded flat" that is forming since March 2015. The dollar has declined which establishes the final part of the wave on the chart (C) since the beginning of this year. In the current month, the main course of the trend has changed to the opposite. This plot of the trend formed the final part of the hidden correction. After it has been completed, a new round of the main trend of the dollar is anticipated.
Yesterday, the price index reached the lower limit of the estimated potential reversal zone. A reversal structure on the graph of the index at the time of analysis is not observed. The beginning of the decline does not have a sufficient wave level.
In the upcoming trading session, the dollar exchange rate is likely to be in the flat area of the resistance zone. The second half of the day is expected to be more active, with the descending direction of the index.
Boundaries of resistance zones:
- 93.30 / 40
Boundaries of support zones:
- 92.80 / 70
Explanations to the figures: For simplified wave analysis, a simple waveform is used that combines 3 parts namely A, B, and C. All types of correction are created and most of the impulses can be found in these waves. Every time frame is considered and the last incomplete wave is analyzed.
The areas marked on the graphs indicate the probability of a change in the direction of motion has significantly increased as calculated in the areas. Arrows indicate the wave counting following the technique used by the author. A solid background of the arrows signifies the structure has been formed while the dotted one means the expected wave motion.
Attention: The wave algorithm does not take into account the duration of the movement of tools in time. The forecast is not a trading signal! To conduct a bargain, you need to confirm the signals used by your trading systems.


