


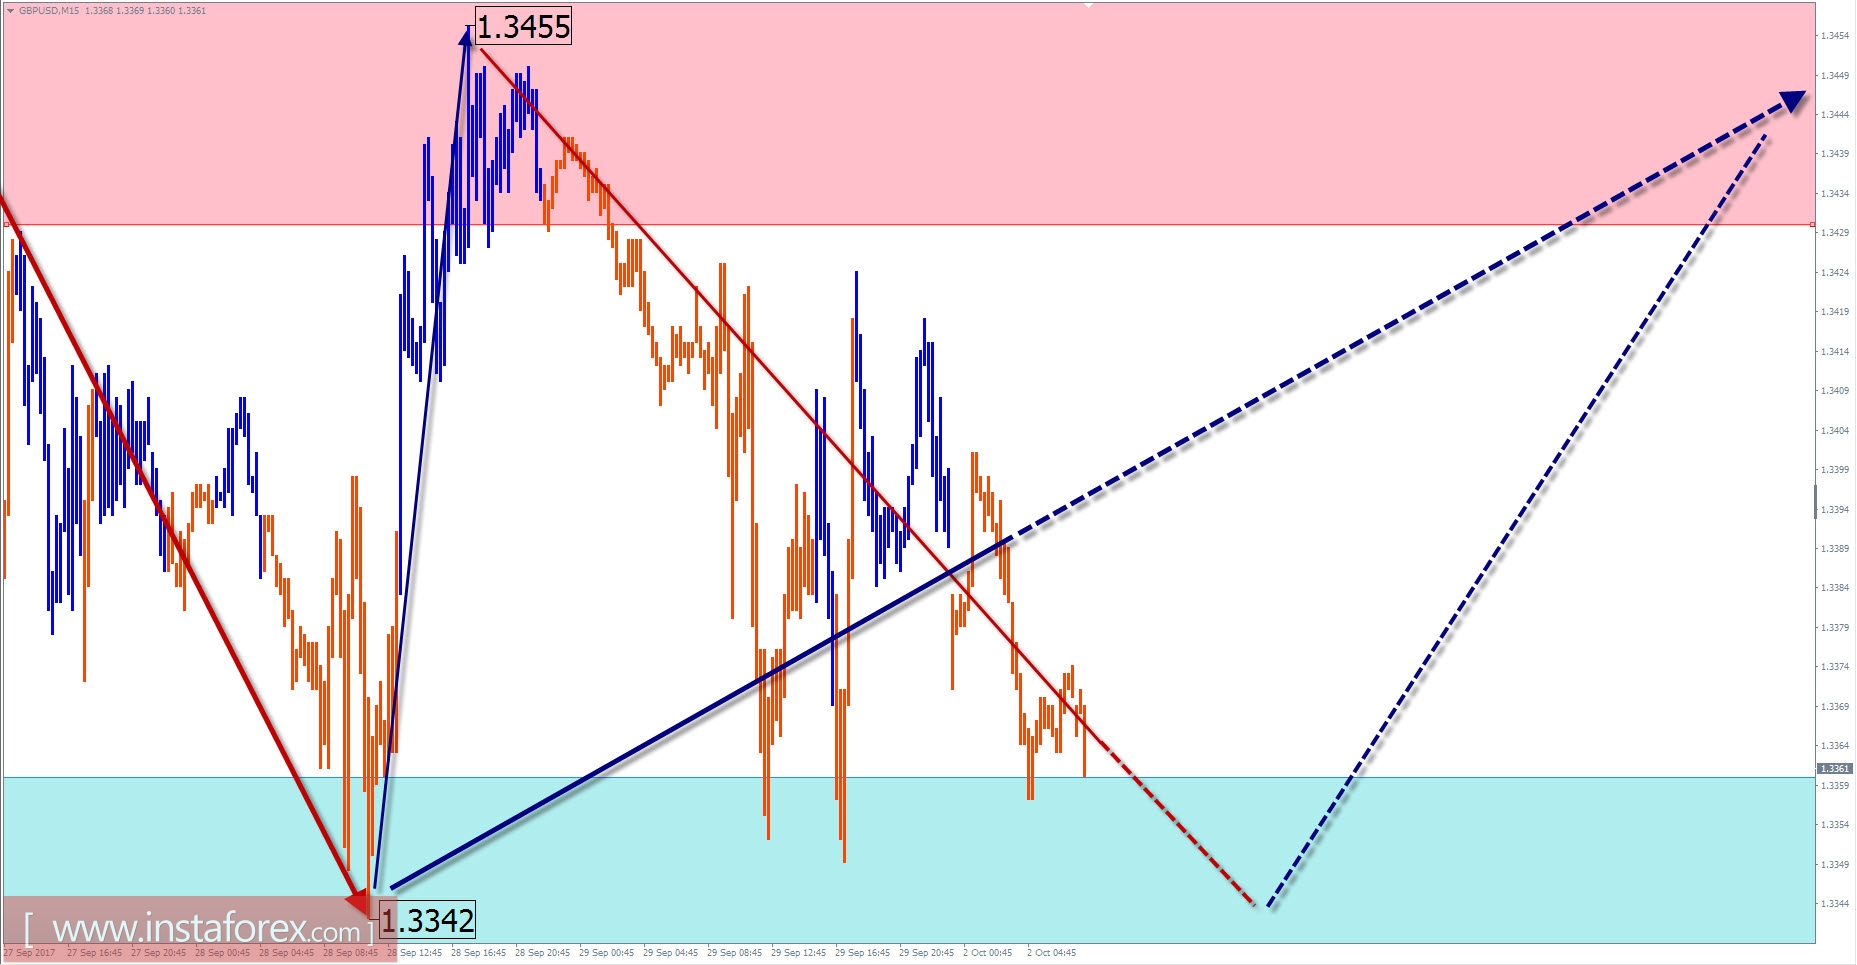
GBP / USD outlook for the current day
On a weekly scale, the price forms a correction as shown on the chart of the British currency major pair since the beginning of the year. The potential reversal zone located above the quotations of the local high of September is limited by the ascending wave motion of the instrument for short-term. Analysis of the structure of the wave shows the structure has been fully completed.
There is a high probability for a flat descending wave from mid-September to form a reversal structure which precedes the descending wave of a larger scale. Since the middle of last week, there have been signs of the formation of the middle part. The structure lacks the final segment.
Today, a common flat tone is possible within the formed price corridor. After contact with the support zone in the morning, the price will be further turned and expected to move upwards.
Boundaries of resistance zones:
- 1.3430 / 60
Boundaries of support zones:
- 1.3360 / 30
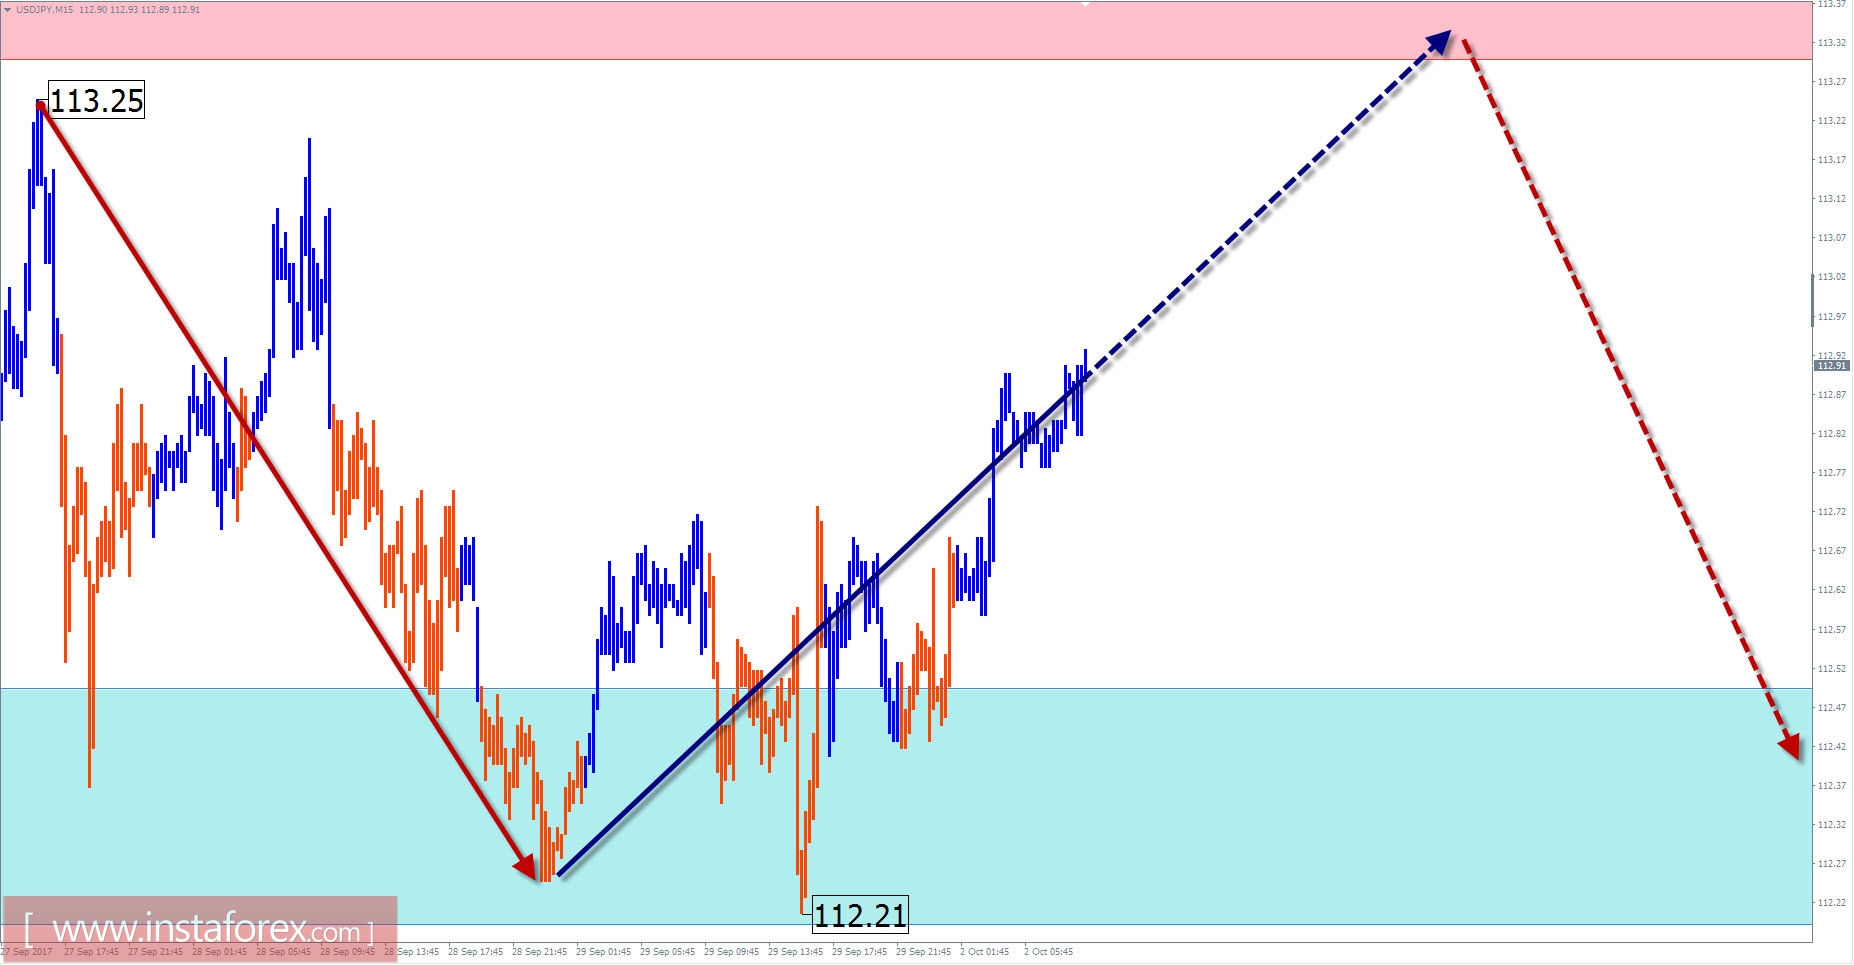
USD / JPY outlook for the current day
The price of the Japanese yen major pair moves in line with the downward wave that dominated the end of last year.
A zigzag wave pattern is formed within the motion that occurred in the middle part of the wave (B). The final part of the correction started on September 8 which is close to completion. Above the current level of the pair is the price segment with the possibility to become a turning zone.
In the next session, traders could wait for attempts to pressure the resistance zone for today. A breakout in the upper boundary of the zone is not ruled out. The probability of changing the direction of the inter-trend will increase and the beginning of a decline.
Boundaries of resistance zones:
- 113.30 / 60
Boundaries of support zones:
- 112.50 / 20
Explanations to the figures: For simplified wave analysis, a simple waveform is used that combines 3 parts namely A, B, and C. All types of correction are created and most of the impulses can be found in these waves. Every time frame is considered and the last incomplete wave is analyzed.
The areas marked on the graphs indicate the probability of a change in the direction of motion has significantly increased as calculated in the areas. Arrows indicate the wave counting following the technique used by the author. A solid background of the arrows signifying the structure has been formed while the dotted one means the expected wave motion.
Attention: The wave algorithm does not take into account the duration of the movement of tools in time. The forecast is not a trading signal! To conduct a bargain, you need to confirm the signals used by your trading systems.


