


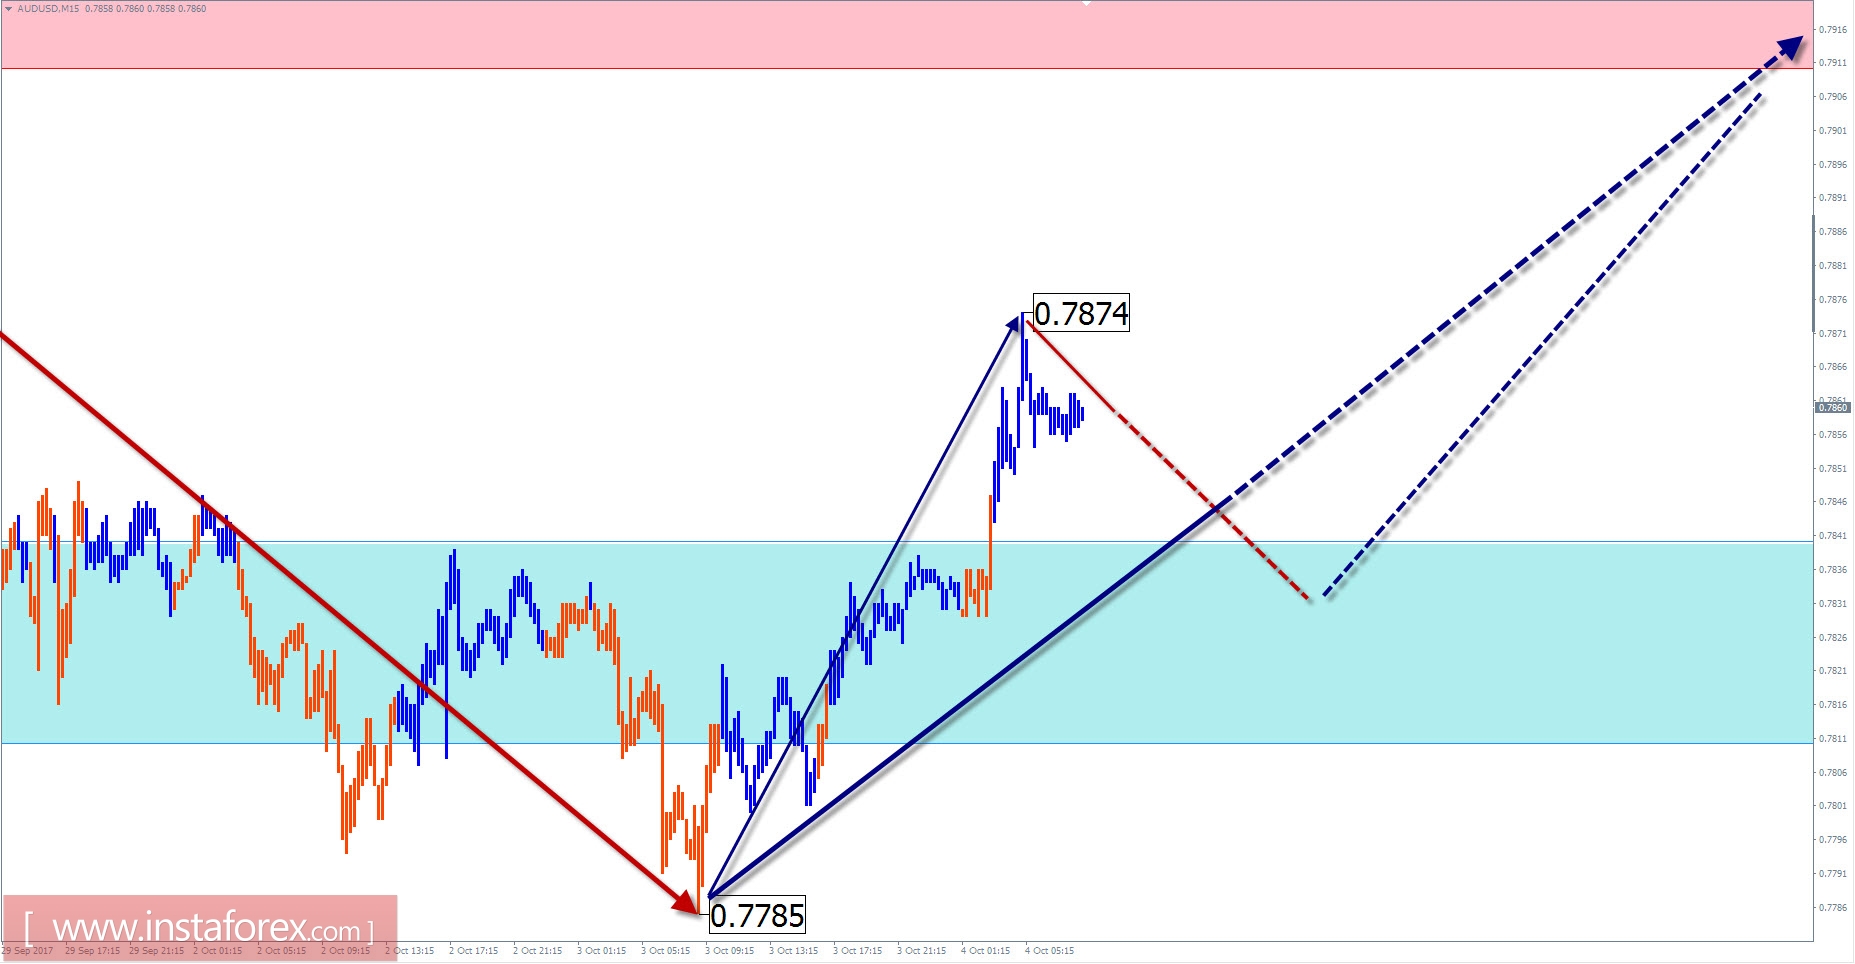
Overview of AUD / USD with the current day forecast
The formation of price fluctuations in the main pair of the Australian dollar in the short-term time scale occurs within the development of the last downward wave. It has a pronounced corrective character, forming on the chart the figure of the "expanding triangle", popular recently in the foreign exchange market. The final part of this wave (C) formed a downward trend last month.
Calculating the intended reduction target shows a limited downward potential. Before a possible continuation of the price move down the pair, it is necessary to work out at least an intermediate correction.
Since the end of last week, price fluctuations have formed a corrective correction wave, in which the final stage of the movement started from yesterday. The next session is quite likely to roll back, not beyond the support zone. In the afternoon, the continuation of the trend that began yesterday is expected. The estimated level of completion of the recovery is within the resistance zone.
The boundaries of the resistance zones:
- 0.7910 / 40
The boundaries of the support zones:
- 0.7840 / 10
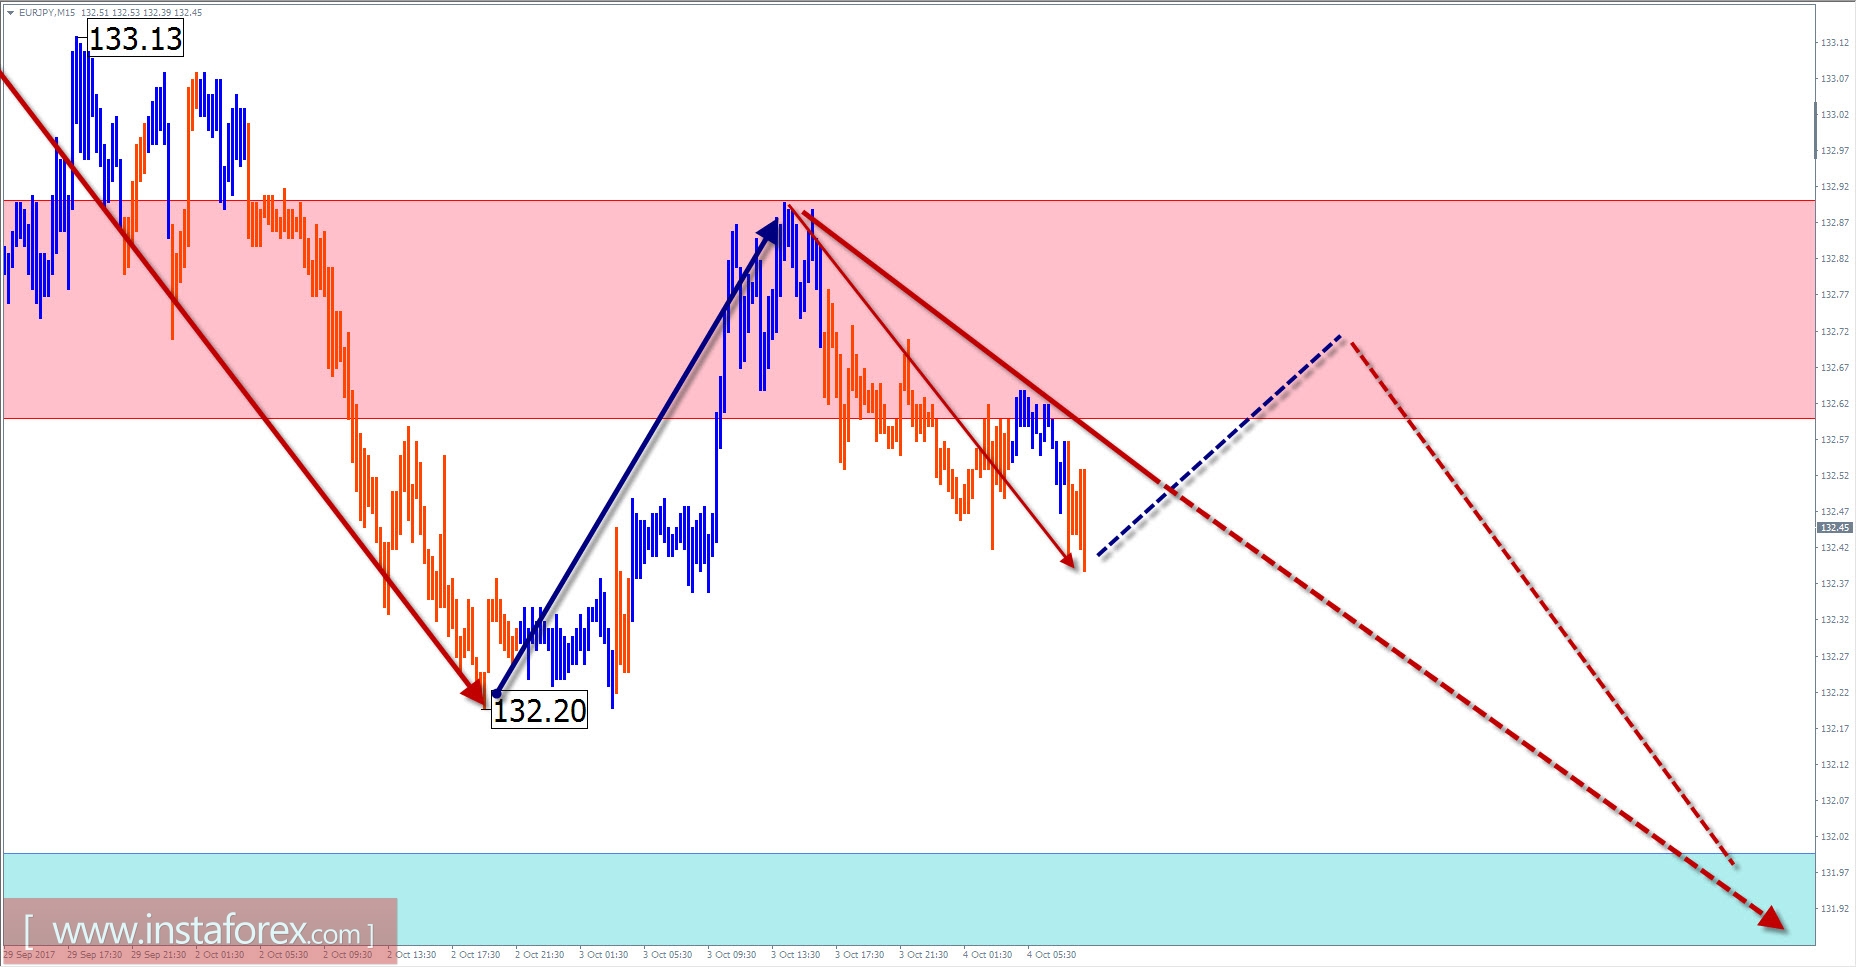
Overview of EUR / JPY with the current day forecast
The direction of the short-term trend of the euro / yen cross is set by the upward wave of April 17. In a larger wave formation, it takes the place of the final part (C), which explains the impulsive nature of the motion. The preliminary calculation of the target zone shows the expected progress to its lower limit in the region of 5 price figures from the current values.
In the last decade of September, the chart began to form a downward rollback, the purpose of which is to raise the wave level of the current trend wave. Calculating its potential allows you to wait for the price move down within the price shape.
Today, in the morning, an upward movement vector is expected. In the framework of the calculated resistance zone, one can then count on a change in the rate and a re-decrease.
The boundaries of the resistance zones:
- 132.60 / 90
The boundaries of the support zones:
- 132.00 / 131.70
Explanations to the figures: For simplified wave analysis, a simple waveform is used that combines 3 parts (A; B; C). Of these waves, all kinds of correction are composed and most of the impulses. On each considered time frame the last, incomplete wave is analyzed.
The areas marked on the graphs are indicated by the calculation areas in which the probability of a change in the direction of motion is significantly increased. Arrows indicate the wave counting according to the technique used by the author. The solid background of the arrows indicates the structure formed, the dotted line indicates the expected wave motion.
Attention: The wave algorithm does not take into account the duration of the tool movements in time. The forecast is not a trading signal! To conduct a trade transaction, you need to confirm the signals of your trading systems.


