


EUR / USD pair
To open long positions for EUR / USD pair, you need:
Securing the level above 1.1778 in the morning will be a good signal to increase long positions in order to update the large resistance level 1.1826, where fixing the profit is recommend. In the event of an unsuccessful attempt to consolidate above 1.1778, it is best to postpone purchasing until it upgrades at the level of 1.1737 with the formation already there of a false breakdown or for a rebound from the lower border of the channel 1.1698.
To open short positions for EURUSD, you need:
Investors will try to form a false breakout at the level of 1.1778 and return the trade to this range, which will lead to a possible decline in the European currency. A repeat test of this area will be an additional signal to increase the short positions on the euro in terms of updating the 1.1698 level. If the euro rises above 1.1778, it is best to return to selling this pair for a rebound at 1.1826.

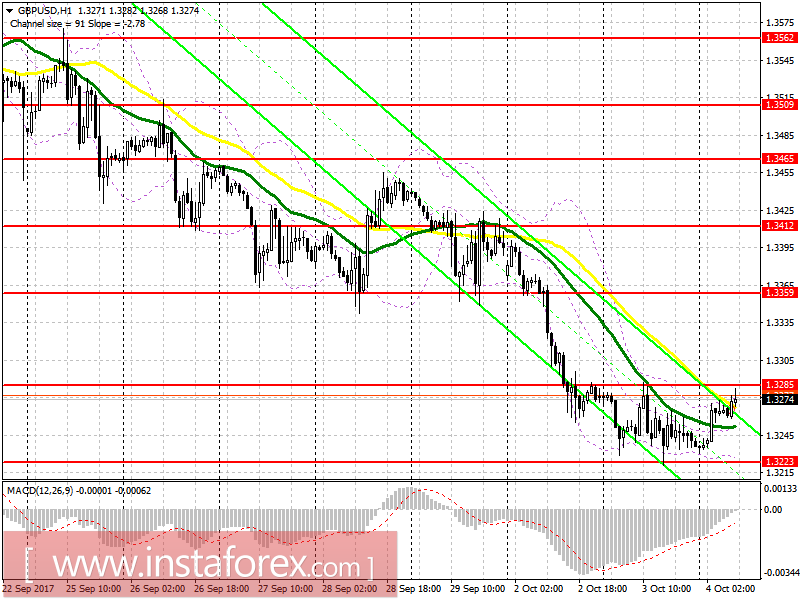
GBP / USD pair
To open long positions for GBP/USD pair, you need:
It is best to return to buying the pound only after the breakdown and consolidation above 1.3285, which will lead to a larger correctional wave to the area of 1.3359. It is quite possible to further move towards 1.3412, where fixing the profit is recommended. If getting above the level of 1.3285 fails, it is better to go back to long positions of the pound when the lower boundary of the channel moved to 1.3223, with the formation of a false breakdown there, or a rebound from 1.3160.
To open short positions for GBP/USD pair, you need:
The formation of a false breakout at 1.3285 and returning to the level because of a weak data on the service sector may lead to a larger decrease in the British pound to the lower channel boundary area of 1.3223, where fixing the profit is recommended. The break and consolidation below 1.3223 will be a new signal for the opening of short positions for the purpose of a test at 1.3160. In the case of growth above 1.3285, it best to return in selling the pair to a rebound from 1.3359.
Fears of indicators
- MA (average sliding) 50 days - yellow
- MA (average sliding) 30 days - green
- MACD: fast EMA 12, slow EMA 26, SMA 9
- Bollinger Bands 20
To familiarize with the basic concepts and the general rules of my TS is possible here.


