


GBP/JPY
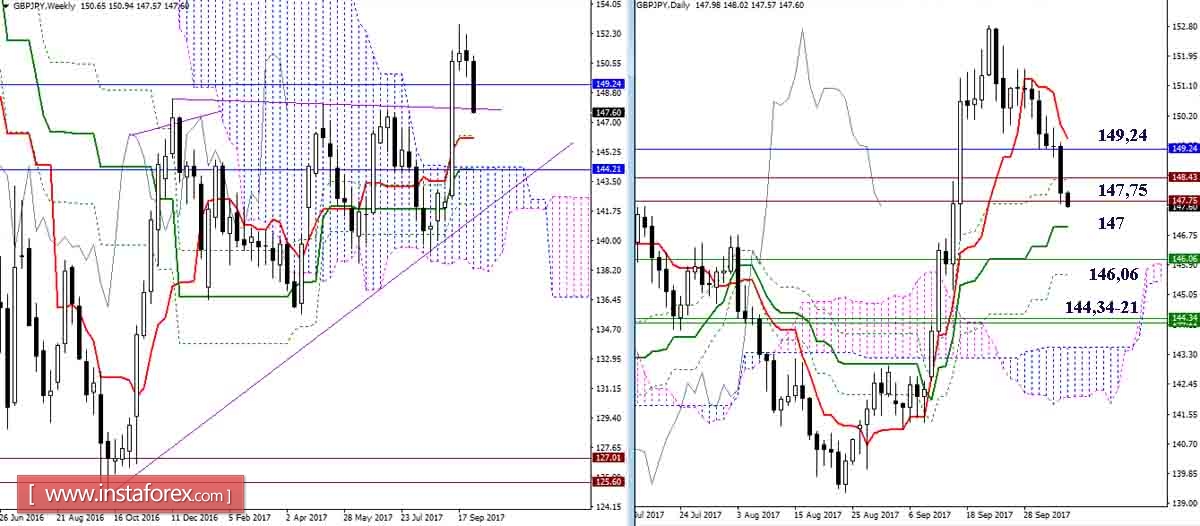
The pair continued its decline and is currently testing the lower limit of the support zone (147.75). The immediate support, in the case of resumption of the decline, is located today on the daily Kijun (147). Further, the most strengthened and significant reference points for bears are levels 146.06 (week Tenkan) and 144.21-34 (weekly Kijun + week Senkou Span B + monthly Tenkan).
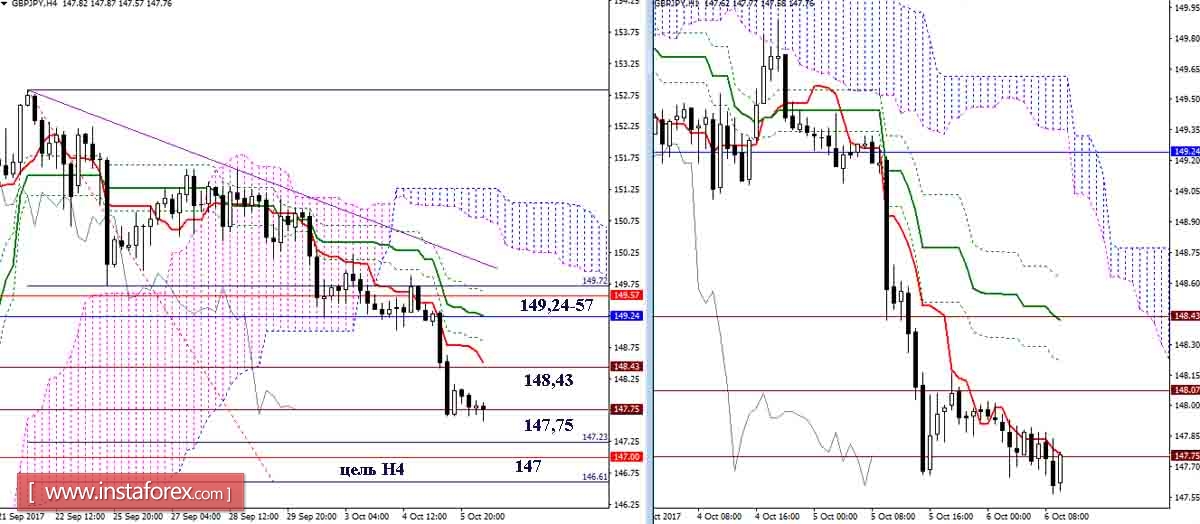
The players on the downgrade now retain full support for their moods and prospects from the indicator Ichimoku. The main benchmark for this decline from junior timeframes is the downside target for the breakdown of the H4 cloud, reinforced by the daily Kijun (147.00). The level of 147.75 (Tenkan H1 + historical high-tier level) has been the center of attraction, support and resistance for the last few hours, 148.43 (Tenkan H4 + Kijun N1 + historical level) and zone 149.24-57 (the final boundaries of the cross H4 + cloud H1 + levels of the senior half).
EUR / JPY
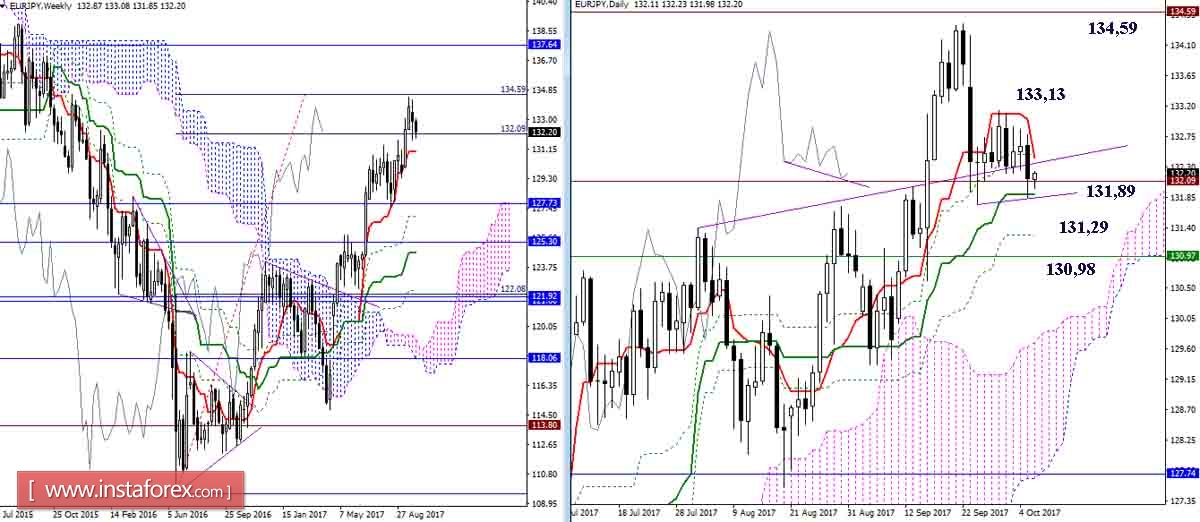
The pair descended to support the daily Kijun (131.89). On the daytime timeframe, the prerequisites for the formation of the Chinkou divergence are now formed, so if the players on the downgrade can not now consolidate below the supported supports, then the probability of recovery of bullish positions and a new rise to the level of 100% of the weekly target (134.59) increase. Overcoming the supports will open the way to the week-long Tenkan (130.98), through the liquidation of the day's cross (Fibo Kijun 131.29).
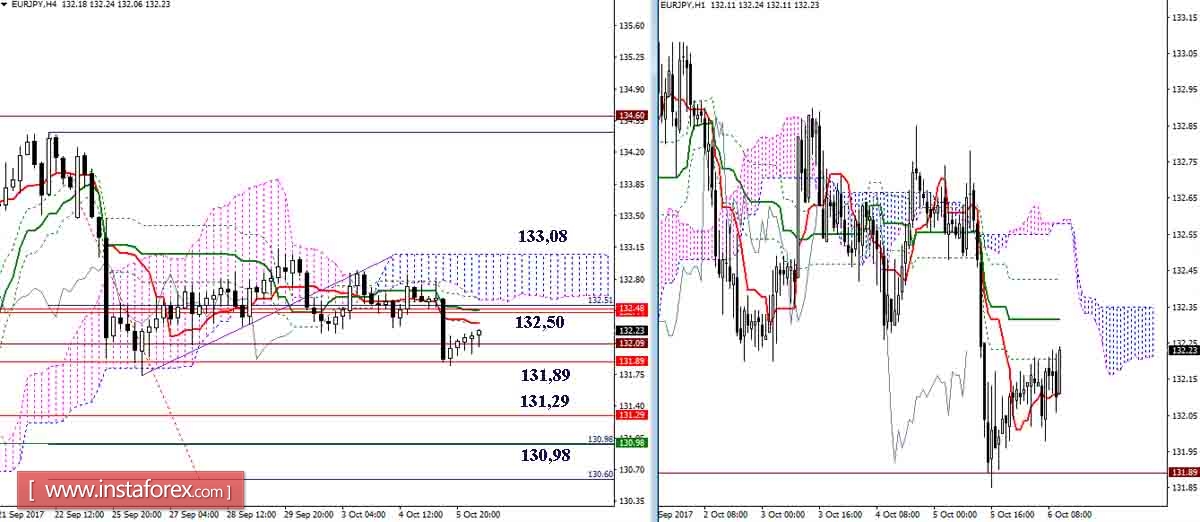
In the minor times, the bears left the zone of lateral movement, but so far they could not overcome the important support (132.09-131.89). Overcoming support data can affect the existing balance of power. The benchmarks for continuing the decline are the high-tier levels (131.29 + 130.98) and the target for the breakdown of the H4 cloud. The most important resistance in the current situation is the area of 132.50 (basic levels of Ichimoku junior and senior times) and 133.08 (Senkou Span B N4). Fastening above the indicated levels will first return the pair to the uncertainty of lateral movement and consolidation, and then form new upward goals.
Indicator parameters:
All time intervals 9 - 26 - 52
The color of the indicator lines:
Tenkan (short-term trend) - red,
Kijun (medium-term trend) - green,
Fibo Kijun - green dotted line,
Chinkou - gray,
Clouds: Senkou Span B (SSB, long-term trend) - blue,
Senkou Span A (SSA) - pink.
The color of additional lines:
Support and resistance MN - blue, W1 - green, D1 - red, H4 - pink, H1 - gray,
Horizontal levels (not Ichimoku) - brown,
Trend lines - purple.


