


After breaking the support at 1.2935. The GBP/USD pair has set strong resistances at the levels of 1.2935 because the support has become a resistance.
So, the price has already formed the strong resistance at the level of 1.3030 and the pair probably will try to approach from it in order to test it again.
However, if the pair fails to pass through the level of 1.3030, the market will indicate a bearish opportunity below the new strong resistance level of 1.3030 (the level of 1.3030 coincides with the ratio of 78% Fibonacci).
Moreover, the RSI is becoming to signal a downward trend, as the trend is still showing strong above the moving average (100) and (50). Thus, the maket is indicating a bearish opportunity below the 1.3030 level so it will be a good sign to sell at 1.3030 with the first target of 1.2935 to return again with a view to test.
It will also call for a downtrend in order to continue towards 1.2935. The daily strong support is seen at 1.2935.
It is also worth noting that the price at 1.3030 will possibly form a strong resistance. Accordingly, saturation around 1.3030 to rebound the pair is likely to occur.
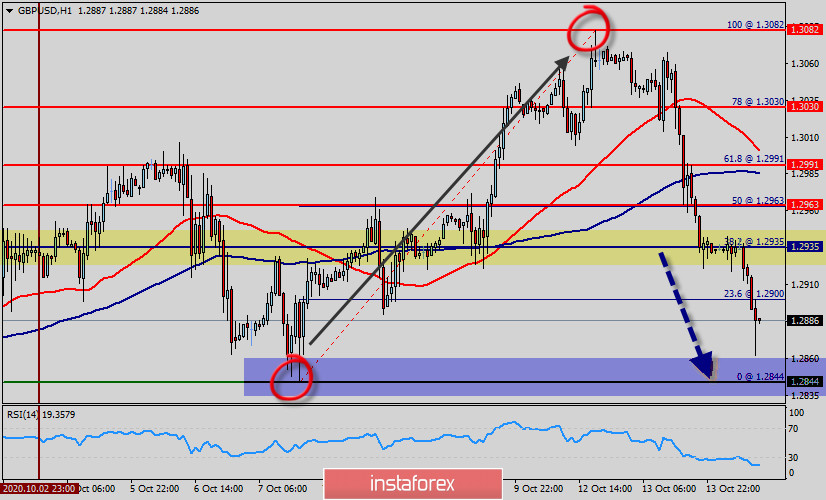
Furthermore, it is possible that the market is going to start showing the signs of bearish market. Hence, it will be a good sign to sell below 1.3030 with the first target of 1.2900 and continue towards 1.2844 and 1.2805.


