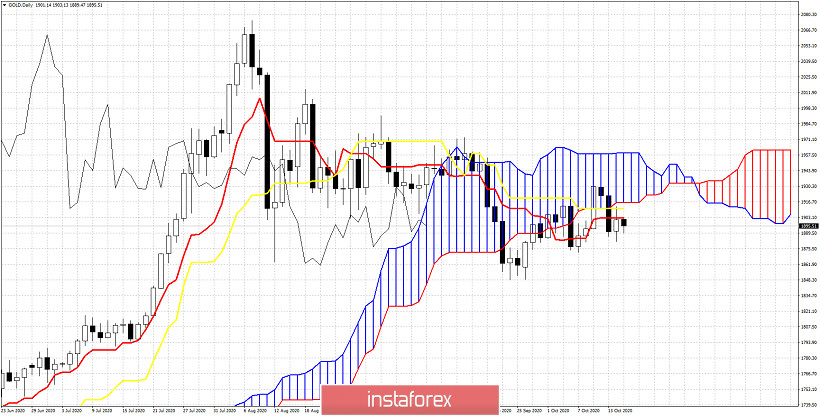
The Ichimoku cloud indicator in the Daily chart warns Gold bulls that unless they step in soon, we should expect a strong pull back. Gold price has broken below the Daily Kumo (cloud) support and despite the efforts by bulls to recapture key levels, we see failure to do so.

Gold price is below the Kumo. This is the most important sign so far. Each time price tries to get inside the cloud we see a rejection and selling pressure. This is a bearish sign. Price is below both the tenkan-sen (red line indicator) and the kijun-sen (yellow line indicator). This is bearish. The Chikou span (black line indicator) is below the candlestick pattern and this is also bearish. Bulls need to recapture the $1,917 level soon otherwise we could see a strong sell off towards $1,850-$1,800. Support is found at recent lows at $1,882. Breaking below this level will increase dramatically the chances for a move towards $1,850-$1,800.


