


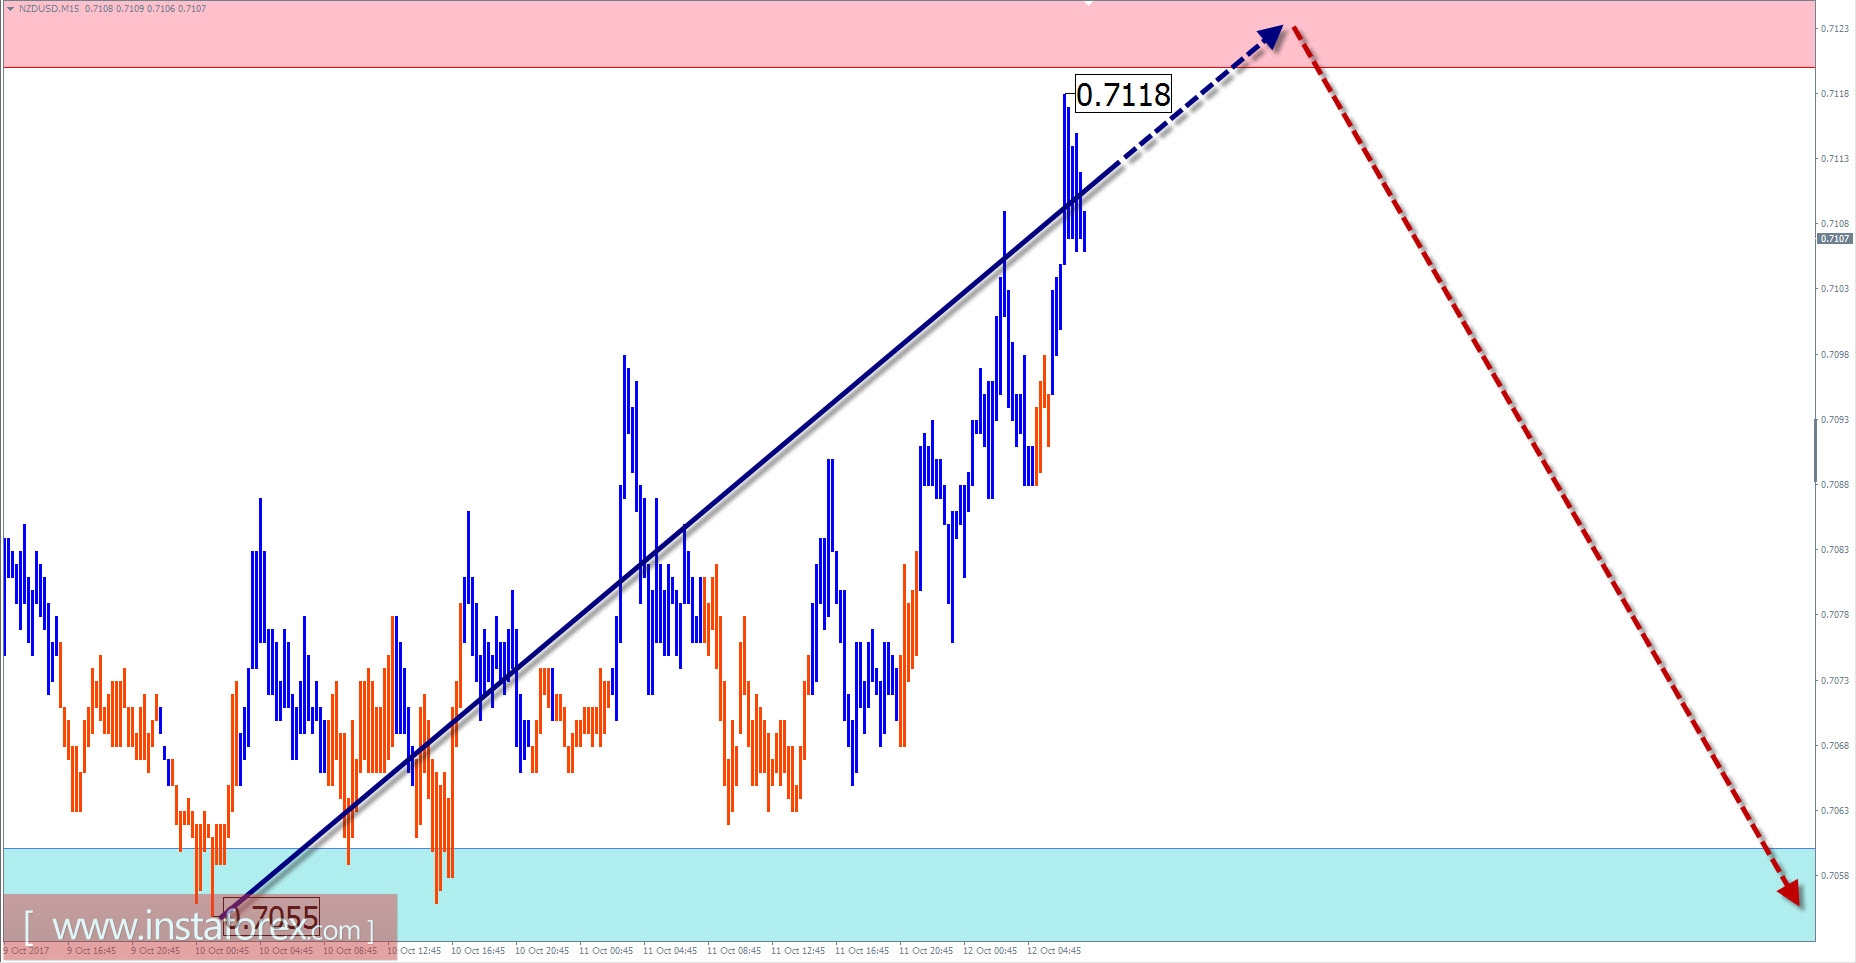
Overview of NZD / USD with a forecast for the current day
In the general picture of the main pair of New Zealand dollar market, the last section is set, which sets the main direction in the short term. The bearish wave started on July 27 and by now has entered the final phase. In its structure, a distinct zigzag is tracked. The proportions of all parts are met, the preliminary goals of the movement are achieved. The quotations of the pair rest against the upper edge of a wide, potentially large-scale, reversal zone. To change the course, the reversal design is not enough.
In recent days, the price forms an upward rollback.
Today, the most common downward mood is expected. The change of direction is expected at the nearest session within the framework of the calculated resistance zone. The predominant nature of price fluctuations will be close to the flat.
The boundaries of the resistance zones:
- 0.7120 / 50
The boundaries of the support zones:
- 0.7060 / 30
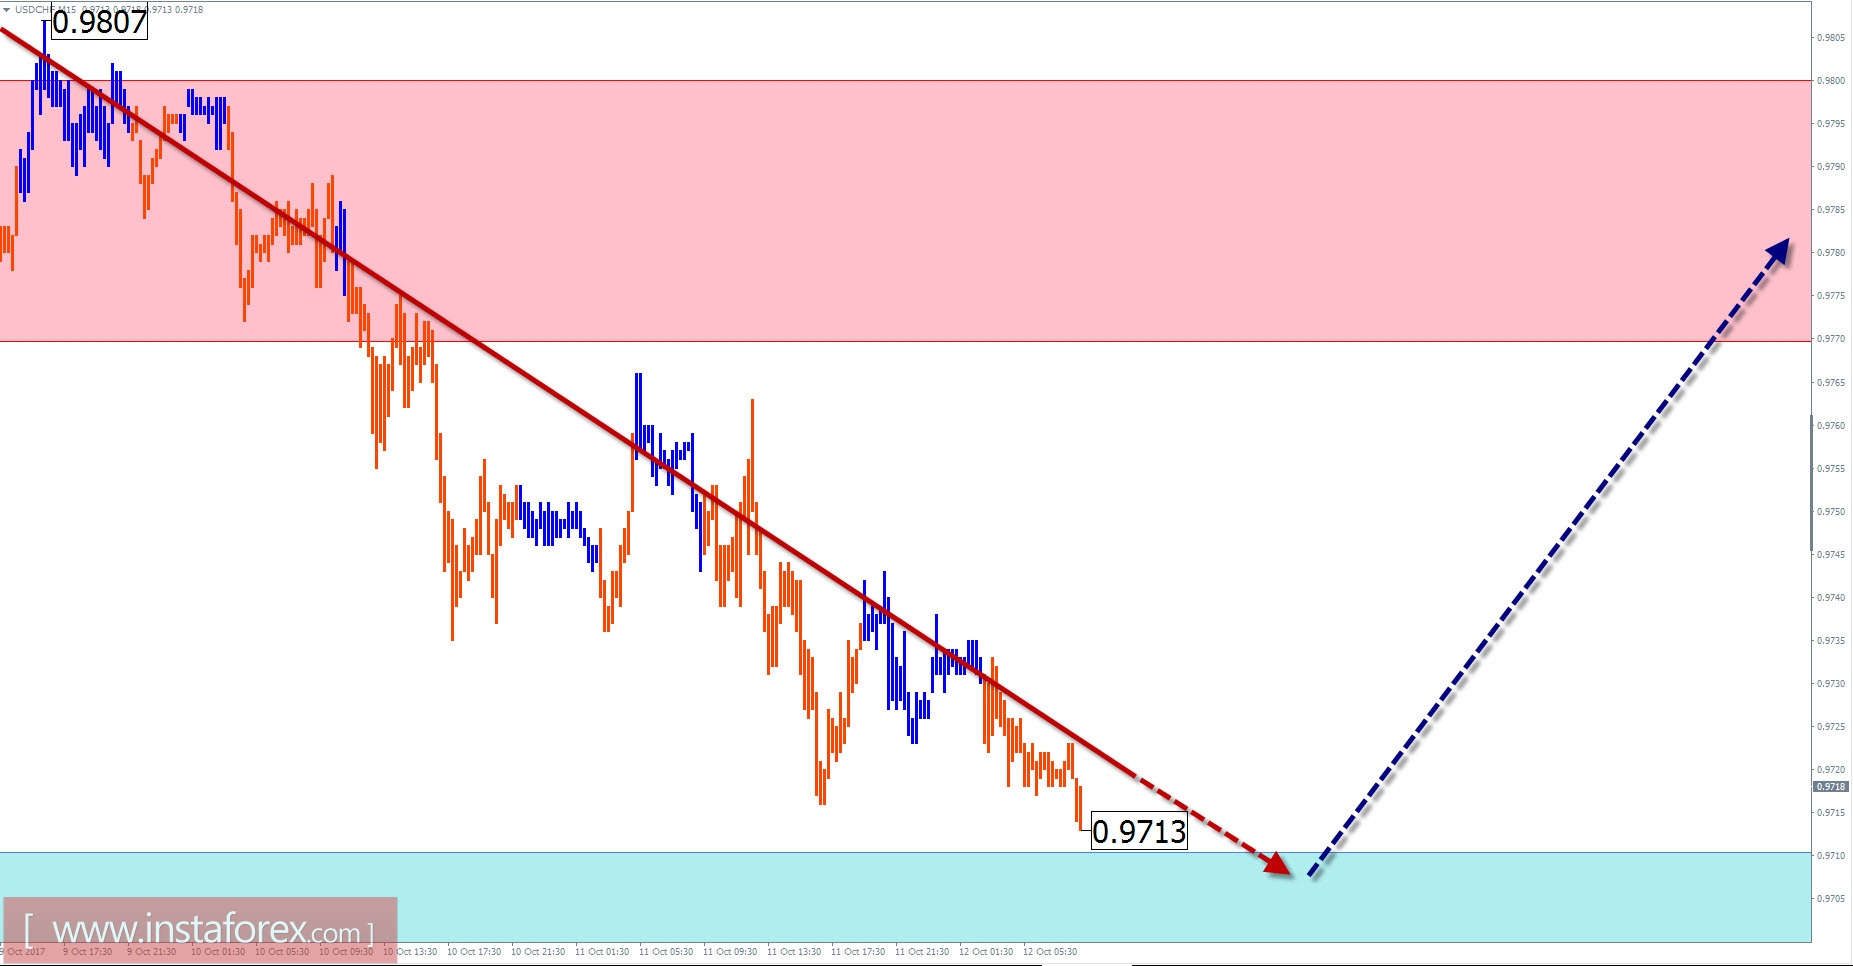
Overview of USD / CHF with a forecast for the current day
The prospects for intraday trading on this pair explains the wave analysis of recent months. From the end of August, the trend direction is set by the rising wave. Since September, the final part of the wave (C) is forming. A week ago, the price reached the minimum calculated level, on which the whole construction can already be completed.
The downward section of the chart from October 6 so far has an insufficient unfolding potential for changing the trend. Perhaps, after the completion of a downward rollback, the overall wave level will give rise to a larger bearish wave.
Today, an upward movement phase (B) is expected to form. The range of the daily course upwards limits the resistance zone.
The boundaries of the resistance zones:
- 0.9770 / 0.9800
The boundaries of the support zones:
- 0.9710 / 0.9680
Explanations to the figures: For simplified wave analysis, a simple waveform is used that combines 3 parts (A; B; C). Of these waves, all kinds of correction are composed and most of the impulses. On each considered time frame the last, incomplete wave is analyzed.
The areas marked on the graphs are indicated by the calculation areas in which the probability of a change in the direction of motion is significantly increased. Arrows indicate the wave counting according to the technique used by the author. The solid background of the arrows indicates the structure formed, the dotted one indicates the expected wave motion.
Attention: The wave algorithm does not take into account the duration of the tool movements in time. The forecast is not a trading signal! To conduct a trade transaction, you need to confirm the signals of your trading systems.


