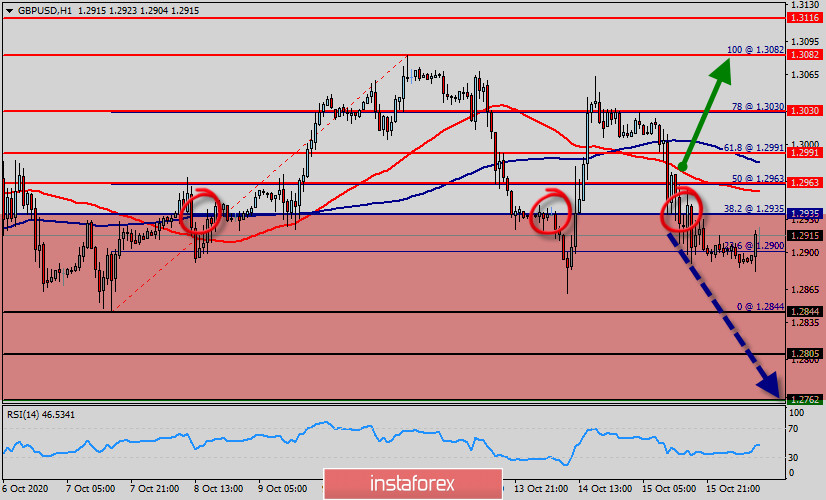
The GBP/USD pair was trading around the area of 1.2935 a week ago.
Today, the level of 1.2935 represents a weekly pivot point in the H1 time frame.
The pair has already formed minor resistance at 1.2935 and the strong resistance is seen at the level of 1.3030 because it represents the weekly resistance 1.
So, major resistance is seen at 1.3030, while immediate support is found at 1.2900.
This resistance (1.3030) has been rejected two times confirming the validity of a downtrend.
Please notice that this scenario will be invalidated if the price reverses above the wave 2 highs at the level of 1.3030.
If the pair closes below the weekly pivot point of 1.4478, the GBP/USD pair may resume it movement to 1.2900 to test the weekly support 1.
From this point, we expect the GBP/USD pair to move between the levels of 1.2963 and 1.2762.
Equally important, the RSI is still calling for a strong bearish market, because the Relative Strength Index on the one-hour chart is flirting with the 30 level – nearing oversold conditions.
As well as the current price is also below the moving average 100. Momentum remains to the downside and the GBP/USD pair is trading below the 100 and 50 Simple Moving Averages.
The GBP/USD pair has broken key support at the levels of 1.2991 and 1.2963, time to sell right now around the spot of 1.2963 - 1.2935.
Price has finally broken our ascending support line triggering a strong bearish drop as expected from the are of 1.2963 - 1.2935. We look to sell on strength below major resistance at 1.3030.
As a result, sell below the weekly pivot point of 1.2935 with targets at 1.2844 and 1.2805 in order to form a double bottom.
Nevertheless, stop loss should always be taken into account, accordingly, it will be of beneficial to set the stop loss above the last bullish wave at the level of 1.3030. But, we still expect the bearish trend for the upcoming sessions as long as the price is below the 1.3030 price.
Conclusion :
If the GBP/USD pair is able to break out the first support at 1.2935, the market will decline further to 1.2844. In the H1 time frame, the pair will probably go down because the downtrend is still strong. Consequently, the market is likely to show signs of a bearish trend. Hence, it will be good to sell below the level of 1.2935 with the first target at 1.2900 and further to 1.2844, then 1.2805. Since there is nothing new in this market, it is not bullish yet. Sell deals are recommended below the level of 1.2935 with the targets indicated above. Major support is already set at the point of 1.2762. The pair is likely to move downwards continuing the development of a bearish trend to the level of 1.2762 in order to test the weekly support 3.


